
Sunday, January 16, 2011
0
End of Week Market Analysis - 15th January, 2011
The Market The S&P/ASX200 (XJO) closed the week at 4801.4 points, just above its long term resistance of 4800 points. Is it going to repeat the November 5 and December 23 2010 tops and correct falling, or is this a new leg in the re-flation of the Australian stock market?
Observe that the medium term trend line remains intact, on both the weekly (shown below) and daily charts. Price action has stayed resiliently above the 260 day EMA since September 2010.
 There are 2 clear medium/long term support and resistance lines at 4200 and 4800 respectively. The previous 5000 high has not been touched since the May flash crash of 2010. What will it take to see a new bullish leg - what should we look for?
For a sustained, medium term trend, I look for the following:

 The chart opposite shows quarterly momentum, obviously increasing from September lows. Although it has breached the 5% signal line, it has done this before, at both 4800 resistance points. The DMI chart shows a similar tendency to approach its upper signal line, but fail on retracement. This is the major concern, even though price action would suggest a new medium term trend is possible. The daily chart opposite shows the very large bullish candle on Thursday (which happened when your blogger was riding his motorcycle to Perth to get it serviced, and his laptop failed. Damn you Toshiba cr&ppy netbook! At least the coffee in the customer's lounge was good quality...) Using just price action analysis, opportunities abound for selling spreads under the recent moves, given the strong levels of support both short- and medium-term. Until confirmation of new trend, the main signal being subsequent weekly closes above 4800 points, and quarterly momentum EMA above the 5% signal line - I would suggest the following:
On raw price action, the Commonwealth Bank may be forming a cup-and-handle pattern, approaching local resistance at $51.50, with short term support at the psychological key level of $50 (who knows why - people like big round numbers?) and medium term support at $47.50. In the short term, CBA is in a quick upward move, with short-term momentum about to cross its "long" signal line. Again, perhaps the enticement of a very large dividend yield and a "safe" bank (sic) is encouraging new investors - but like WBC, volume doesn't support that thesis. Watch for confirmation of short term uptrend in the coming week, with possible long strategies (e.g $51 Feb call or ATM warrant).


After a very long correction since the May flash crash of 2010 and bottoming in October, it has roared back, displaying a very common pattern - the flat base and has subsequently broken out in a FAST short term uptrend. I'll expand on Macquarie's recent price action and how to spot and use this pattern (see right) in a separate post. MQG has changed its cycle from sideways bearish to bullish, with long term cyclical indicator not yet confirmed by quarterly momentum, but a crossover of the DMI and a weekly close above the 260 day EMA is bullish.  In the short term, MQG is in a short/medium term uptrend, approaching the $40 resistance level (created by the indecision in June-Aug 2010). Secondary indicators suggest continued strength, although the first stage KC Signal (too fast) has been triggered, with possible retracement in days ahead. Given the structural change in MQG's stance, retracements allow for re-entry into a continued breakout (or a lower point of risk in case of bearish change)
As predicted in last week's analysis, BHP continues its sideways bullish stance, with slowing momentum. Price activity still remains above the once $45 resistance, now support level.  Quarterly PDI on the DMI is falling, but quarterly momentum remains above its own EMA and lower signal line. In the short term, BHP is moving around within its continued medium term trend. Failure to close above the previous $46.50 level in the coming week would suggest a good time to take profits. BHP is profiting handsomely from the ridiculous QE2 inflation coming out of the NY Federal Reserve. Watch for volatility in commodity prices (coal, iron ore, gold, crude oil, copper and nickel) in the coming weeks, but QE2 is going to last until March or even June at this stage. Further, the possibility of very large share buybacks by "the big Australian" will likely keep BHP elevated for some time.
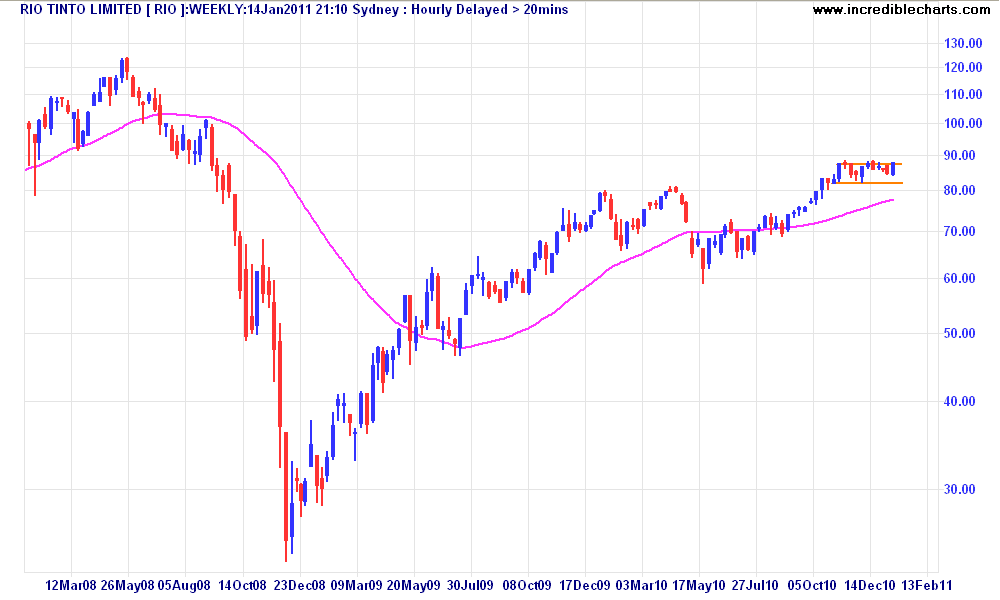
 It's struggling to move past resistance at $87.50, but bounces off support at $82. This simple price action suggests use of OTM strangles (e.g $90/$80), but of course, the trader needs to be careful that factors out of his control (e.g QE2 as mentioned above leading to commodity prices bubbles) could cause RIO to jump to $120 or crash to $60 in short time!
At this stage, I would want to keep a close eye on the short term price action, particularly breakouts above $88 or so. RIO could move swiftly up from this level. Recent price action indicates a new short term trend, confirmed by cyclical and directional indicator, although momentum is yet to cross the signal line. (see chart above)  WOW is now on a tear, its "End of Correction" confirmed and then upgraded to "Short Term Uptrend", although Friday's extremely strong bullish candle may mean a small retracement in the coming days. This action is supported by a strong buildup of volume since early January.
 WOW short term trade: Feb $27.50 long ATM call on confirmed medium term trend and/or Feb/Mar $26.50/26 Bull Put Spread
WOW medium term trade: Mar or April $26/25 Bull Put Spread or $26 Cash-secured Put
Observe that the medium term trend line remains intact, on both the weekly (shown below) and daily charts. Price action has stayed resiliently above the 260 day EMA since September 2010.

For a sustained, medium term trend, I look for the following:
- a confirmed break out above the historical resistance level - in this case 4800 points.
- all price action above the 260 and 63 day EMA's, with a rising 63 day EMA
- quarterly momentum rising above 5% signal line (and preferably own EMA)
- quarterly Positive DMI, after a recent crossover, rises above its higher signal line


- XJO short term trade: Feb 4700/4650 Bull Put Spread, looking to scale into additional contracts and/or new Feb 4750/4700 as XJO improves.
- XJO medium term trade: Mar 4600/4500 Bull Put Spread and April (when released)
 |
| WBC falling volume.... |

- CBA short term trade: Feb $49.50/49 Bull Put Spread
Westpac has finished its small correction and may be in a small upward move according to short term price action (2 strong closes above short term moving average and 15 EMA, with long tail/Doji cross candle finding support at $22), but all 3 secondary indicators do not confirm an uptrend (see chart below)
Watch for confirmation of short term uptrend in the coming week, with short term bull put spreads ($21.50 or $22 upper strike prices).
- WBC medium term trade: Mar $21/20 Bull Put Spread
Macquarie has a different structural stance to the "Four Pillar" banks.
 |
| from Chartpattern.com |

- MQG short term trade: possible Feb $39 or $39.50 long call, Feb $37.50/$37 Bull Put Spread
MQG medium term trade: Mar or Apr $35/$34 Bull Put Spread
Miners (BHP, RIO)

- BHP short term trade: take profits on any long trades if price fails to close above $46.50 target next week
- BHP medium term trade: March or April $42/41 Bull Put Spread
RIO has effectively been a sideways bullish stance since early November 2010, although the pattern does resemble a strong bull flat base (see MQG above).
 |
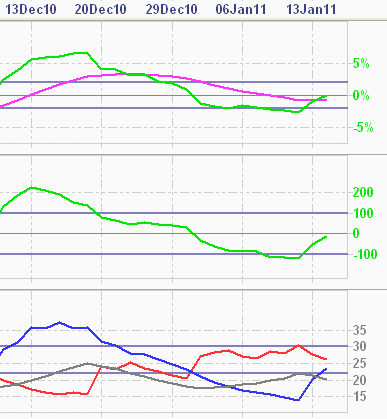
| Momentum (top) not confirmed |
- RIO short term trade: Feb $84/83 Bull Put Spread on confirmation (short term momentum)
- RIO medium term trade: possible long ATM call for short/medium term breakout from flat base

As mentioned in my post on WOW, watch for a sustained move on the PDI on the DMS above 30, support on the quarterly momentum and directional indicators to confirm that medium trend, and then hold on!!
Subscribe to:
Post Comments (Atom)
0 Responses to “End of Week Market Analysis - 15th January, 2011”
Post a Comment