
Showing posts with label WBC. Show all posts
Showing posts with label WBC. Show all posts
Monday, January 24, 2011
0
Monday, January 24, 2011
Chris Becker
 The S&P/ASX200 Index (XJO) closed the week at 4755 points, below long term resistance at 4800 points. The jostle between the bulls and bears continue, with BHP and RIO (discussed in detail below) dragging the market back after a one-day leap across the pivotal 4800 barrier.
 Conclusion
XJO remains a frustrating market, best served at the moment by either standing aside or non-directional trades, with a bullish bias - although the brave few could utilise a long term bear trade at 5000 or more points (I'd book up on macro factors there though! Although I personally believe the current market is overvalued and Australia is heading into a long recession, I can't say the same for those who actually move markets. I find "Jesus" whenever I'm wrong!)
XJO medium term trade: March or April 4600/4500 Bull Put Spread
The Banks (CBA, WBC, MQG)
Commonwealth Bank (CBA), as expected last week, is in a small uptrend which is gathering momentum.

Conclusion
CBA is in a short term trend that wants to manifest itself as a new medium term trend, with a possible target of $60 (by around the end of April?) These are VERY early days yet, and I would caution any medium term trades or capital allocation until CBA earning's announcements on the 9th of February, with ex-dividend on the 14th (possible dividend yield play here...)
CBA short term trade: Feb $49.50/$49 Bull Put Spread
Westpac is again trying to break out of its medium term sideways bearish funk. As mentioned in last week's analysis, a short term uptrend was trying to form, but entry was denied by lack of confirmation by secondary indicators. Permission has since been granted.

Conclusion
WBC is in a weak short term uptrend, yet to be fully confirmed. Structurally it remains in a sideways bearish stance. I remain cautious about putting on any bullish trades (of any substance) at this time.
Macquarie Group (MQG) has finished the week flat after a great breakout. As mentioned in last week's analysis, a KC Signal was forming - and then confirmed with a bearish engulfing candle on the 20th. Good entry point for long share/warrant traders, bad exit for long option (volatility) traders.

Conclusion
MQG has had a great run in the last couple of weeks and is now consolidating before its next move, as it appears overbought. Most secondary indicators suggest a new medium term trend, but the key signal is a crossing of the upper line on medium term momentum, reinforced by a new support area of $40. Be quick on MQG, as always.
MQG possible medium term trade: long warrant/share, on confirmation

Conclusion
Conclusion
Read more...
End of Week Market Analysis - 22nd January, 2011

- Trend - the short term trend is flat, with 15 day EMA going nowhere, but the medium term trend is still intact, with price above the trendline and 13 week EMA.
- Momentum - crucially, medium term momentum will not penetrate the upper signal line. This is no new bull market. In the short term, momentum is positive, but sideways.
- Direction - in the short term, directional strength confirms price action analysis: a positive bias, but no strength. Medium term directional strength is waning, but remains positive.
- Cycle - the medium term cycle remains bullish, although intra-week did fall below a "bull" signal. This weakness extends into the short term cycle, although a break below the 0 line did not eventuate (which would indicate a short term correction)
- Support - support remains at 4700 in the short term and 4200 in the medium/long term.
- Volume - medium term volume is flat, but positive, whilst in the short term, has dipped below zero for the first time since the new year week-long correction.

XJO remains a frustrating market, best served at the moment by either standing aside or non-directional trades, with a bullish bias - although the brave few could utilise a long term bear trade at 5000 or more points (I'd book up on macro factors there though! Although I personally believe the current market is overvalued and Australia is heading into a long recession, I can't say the same for those who actually move markets. I find "Jesus" whenever I'm wrong!)
XJO medium term trade: March or April 4600/4500 Bull Put Spread
The Banks (CBA, WBC, MQG)
Commonwealth Bank (CBA), as expected last week, is in a small uptrend which is gathering momentum.

- Trend - the short term trend is up, with price action all above the 15 day EMA and no closes below the 7 day HI EMA. A medium term trend from the low's of November 2010 may be developing, with current activity in the upper area of a trend channel. Recent price action is above the long term 260 day EMA, which is bullish.
- Momentum - In the short term, momentum confirms a continued short term uptrend, but medium term momentum indicates a bear market rally only at this stage.
- Direction - short term positive strength is dropping slightly, but still confirms above signal line. The medium term PDI has just crossed over the NDI above the signal line, but NDI has not crossed below 20 - trade management rules deny any medium term or large capital allocation until this level drops.
- Cycle - the medium term cycle is now bullish, supporting local/short term cycle.
- Support - there is localised support at $49.50-$50 in the short term and $47.50 in the medium term. CBA reached a high of almost $60 in April 2010, which could be this moves target?
- Volume - volume is positive on both scales, although I'd like to see a higher number of the short-term Force Index.
Conclusion
CBA is in a short term trend that wants to manifest itself as a new medium term trend, with a possible target of $60 (by around the end of April?) These are VERY early days yet, and I would caution any medium term trades or capital allocation until CBA earning's announcements on the 9th of February, with ex-dividend on the 14th (possible dividend yield play here...)
CBA short term trade: Feb $49.50/$49 Bull Put Spread
Westpac is again trying to break out of its medium term sideways bearish funk. As mentioned in last week's analysis, a short term uptrend was trying to form, but entry was denied by lack of confirmation by secondary indicators. Permission has since been granted.

- Trend - the short term trend is up, with classic price action gravitating around the 7 day HI EMA, with no intra-day action touching the 7 day LO EMA. The weekly trend is weak to non-existent.
- Momentum - Like CBA, WBC is technically in a bear market, so any momentum that reverses but is yet to break into positive territory, or cross the upper signal line suggests a very short term rally. Medium term momentum indicates a reversion to the mean and does not yet suggest any sustained price action.
- Direction - The medium term NDI continues to drop, but has not crossed below the lower signal line, whilst PDI floats below. This is reflected in the short term DMI readings, although NDI is obviously dropping, but not yet below the lower signal line.
- Cycle - the short term cycle is bullish, with a great indicator confiriming the end of the previous correction and the start of a new short term trend. The medium term cycle is now sideways bullish.
- Support - there is localised support at $22 in the short term and $21 in the medium term. WBC reached a high of $28 in April 2010, a long way off its current price. There is a sloping resistance line at $23 - a weekly close above this level (this or next week) would strongly suggest a new trend.
- Volume - volume is positive on both scales, rising in the short term, but flat medium-term.
Conclusion
WBC is in a weak short term uptrend, yet to be fully confirmed. Structurally it remains in a sideways bearish stance. I remain cautious about putting on any bullish trades (of any substance) at this time.
Macquarie Group (MQG) has finished the week flat after a great breakout. As mentioned in last week's analysis, a KC Signal was forming - and then confirmed with a bearish engulfing candle on the 20th. Good entry point for long share/warrant traders, bad exit for long option (volatility) traders.

- Trend - the short term trend has finished, but it is likely to move sideways. The weekly trend is a flat base pattern which suggests continued bullishness. Although the close on the 20th was very bearish, it did not break the trailing stop nor close below the 7 day LO EMA.
- Momentum - Medium term momentum is now positive and moving towards the upper signal line to confirm a new medium term trend. Short term momentum, after a classic KC Signal, has retraced but still positive, above upper signal line and own EMA. This signals continued strength.
- Direction - The medium term PDI has crossed the upper signal line, which confirms a new medium term trend. This is reflected in the short term DMI readings, with a very strong ADX signal line (which I use rarely) suggesting overbought conditions.
- Cycle - the short term cycle remains bullish, although it has dipped below the 100 line. The medium term cycle suggests overbought, but is reverting to more sedate conditions.
- Support - there is localised support at $39.50 in the short term and $37 in the medium term. Historical resistance at $40 remains a barrier to a continued move, but will become support if it gets underway.
- Volume - strong volume signals on both scales (positive since October 2010) but flat in the short term.
Conclusion
MQG has had a great run in the last couple of weeks and is now consolidating before its next move, as it appears overbought. Most secondary indicators suggest a new medium term trend, but the key signal is a crossing of the upper line on medium term momentum, reinforced by a new support area of $40. Be quick on MQG, as always.
MQG possible medium term trade: long warrant/share, on confirmation
The Miners (BHP, RIO)
BHP Billiton (BHP), ended the week poorly, although it found some support, on nervousness about China and its runaway economy.
 |
| note close below the trendline but not the 63 EMA (green line) |
- Trend - the short term trend is sideways at best, down at worst, with choppy price action, although supported by the 63 day EMA/13 week EMA. Weekly price has closed below the medium term trendline and all moving averages have 'stacked'. This is bearish for the short- and medium-term.
- Momentum - Medium term momentum has failed to make a new high 3 weeks in a row, but it is still above its own EMA and upper signal line. a bear market rally only at this stage. Short term is below 0 and own EMA, suggesting continued weakness.
- Direction - The medium term PDI has dropped significantly, but is still above its lower signal line. NDI is also very weak. No directional confirmation here at all. Conversely, short term NDI has crossed over its upper signal line due to Friday's poor close. But, PDI is still above its upper signal line. Again, no confirmation here either.
- Cycle - the short term cycle is now bearish, having dropped below -100. The medium term cycle however, has moved from bullish to sideways bullish. This is the clearest signal that a correction is not underway. Yet.
- Resistance - there is signficiant resistance at $46 for BHP, near a 3-year high. i.e BHP is approx. where it was at the height of The GFC Episode One - "The Credit Menace". There is localised support at $44.50 and $43.
- Volume - volume is slipping on both scales, although in the short term it is now negative, in the medium term it has crossed its own EMA - a clear sign of lack of buying support at these high prices.
Conclusion
BHP is at a cross-roads. Will it continue its truly awesome strength and reach new 3 and 4 year highs on the back of increased commodity prices (due to the profilgateness of the US Federal Reserve)- or is it too geared to the miracle China story? Again, I'm looking at a combination of price action (a continued fail below the medium term trendline) and momentum before acting.
BHP: cover all bull trades, stand aside.
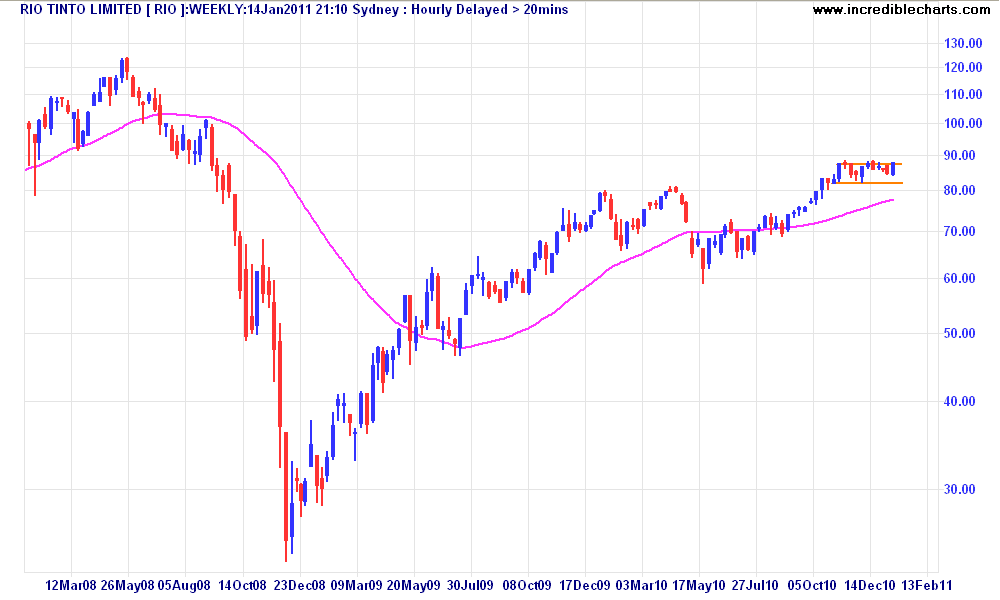
Rio Tinto (RIO), like BHP, ended the week poorly, and continued its sideways action. Are we still witnessing a bullish flat base pattern?

- Trend - the short term trend is down, with lower highs in the past few weeks, although price remains supported by the 63 day EMA/13 week EMA. Weekly close is barely above the 13 week EMA. This suggest continued sideways action for the short- and medium-term.
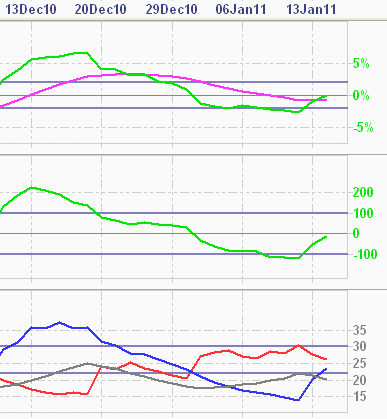
- Momentum - Medium term momentum has now fully slipped below the upper signal line (signifying a sustained medium term trend) but still remains above the lower signal line, indicating continued bullish support. Friday's close took short term momentum to below zero, but EMA is still neutral sideways.
- Direction - Short term NDI has crossed over its upper signal line due to Friday's poor close and PDI is now below its upper signal line. This would normally confirm a new correction is underway.
- Cycle - similarly, the short term cycle is confirmed as bearish, having dropped below -100. The medium term cycle however, has moved to sideways bearish only, but it is closely reverting to a bearish position.
- Resistance - there is signficiant resistance at $88 for RIO, or back to where it was in September, 2008 - similarly to the where commodity prices were then and now... There is localised support at $84 and medium term support at $81.50/82 area.
- Volume - the short term Force Index has been broadly negative for RIO since November 2010, slipping past a support level, whilst it finished the week in the negative on the medium term scale. Like BHP , this indicates a lack of buying support at these high prices.
Conclusion
Is RIO stabilising after a great run up from September to December ($72 to $86) reflecting the Fed's QE2 program - OR - is it getting ready for a large pullback as signs abound that not all is well? Just like BHP, I'm looking at a combination of price action (a breakout above resistance at $88 or a failure at $82) and momentum to confirm before acting.
RIO: cover all bull trades, stand aside.
Woolworths (WOW) Last but not least, let's look at WOW. After a very quick uptrend, WOW has finished the week bearish, with a large sell-off before announcing profit guidance on Monday. Given that JPMorgan recently upgraded WOW to a buy - a great contrarian signal - does this bode well for next week's action?

surfing W O W.... - Trend - the short term trend was sideways bullish and then quickly reversed, although price did not close below the 7 LO EMA, it broke the current trendline. Weekly close is still above the 13 week EMA, but all moving averages are clustering (and frustratingly, the 260 day EMA remains flat).
- Momentum - Medium term momentum remains below zero and its own EMA and is slipping. Short term momentum has closed below the upper signal line and its own EMA which is very bearish.
- Direction - Short term NDI has crossed over its upper signal line due to Friday's poor close, with PDI now below its upper signal line. A crossover is not yet in place. This would normally confirm a new correction is underway. On the medium term scale, NDI is still above the lower signal line, which confirms that the short term trend has no hold, even though PDI is rising.
- Cycle - The medium term cycle attempted a change to a bullish sideways stance but is now neutral. A KC Signal in the short term cycle was confirmed with a move back to sideways bullish. For WOW - which has constant short-term cyclical moves, this signal is very bearish.
- Resistance - WOW has a very long term resistance at $30 and support at $25.50. Localised support at just over $26 is a probable price target in any continued downtrend. A break below that area is unlikely, but makes for great investing opportunities.
- Volume - the short term Force Index spiked before ending the week below its own EMA, another bearish sign. On the medium term scale, it still remains positive.

Conclusion
WOW remains one of my favourite stocks to trade (and company to invest in - sly and demoralising sales tactics it uses with farmers aside) and continues to show that favouritism! I closed a number of trades intra-week due to the volatility and remained concerned at Monday's earnings announcement. Given WOW's previous behaviour, the only trades to consider at the moment is a long dated Bear Call Spread near historic resistance (very low payoff, high probability of success) or a cash secured put for investment purposes (say at $26 or $25.50 level)
WOW short term trade: cover all bull trades, March $29/$29.50 Bear Call Spread
Note: one of my readers recently timed a covered call trade on WOW to perfection - with Friday's fall he made a 14% annualised return, but he is keeping his WOW shares for the long term (doing the trade in Self Manager Super Fund (SMSF). A great strategy combined with cash secured put buying for those with the time, capital and nous to add a few more percentage points of performance to your biggest investment (no your house doesn't count!). I intend to post on this "Super" trading system in the near future. Watch this space.
Monday, January 17, 2011
0
Monday, January 17, 2011
Chris Becker
A very poor day today on the XJO - down 38 points or 0.8%, due to most of below:
XJO itself has bounced off the critical 4800 points level again, and I frankly am getting quite frustrated with this!
I have a modest 4700/4650 Bull Put Spread open on XJO at the moment, but according to my defensive action criteria, I will leave it well alone until the sold position doubles in value (one of my specific stop losses).
It might be time to exit my WOW trades (long and BPS) too - although it hasn't triggered any of my exit signals yet, I have a tidy profit so far. Again, I don't take much credence in directional plays on WOW, but I will keep an eye on this - and keep you updated!
If Europe appears to be correcting, I will use a 24-hour Index CFD (or Option CFD) as my hedge, although I've never had much luck with CFD's!! (Gold is an exception, but mainly due to following some very good trends last year). As of 6pm local time, WA, the European market is down, on aggregate by 0.5%, mainly due to FTSE and CAC (France).
I follow another watchlist, appropriately called my "Crashlist", which includes the following:
I've tried to put live charts on the bottom of the blog for some of these, but I usually analyse them using my Incredible Charts software. (I use the premium version, a free version is available with delayed data and advertisements, but is more than capable for the infrequent trader)
More on the "Crashlist" and how I use it in other post. For the time being, keep your powder dry and watch this market closely. I think the full effect of the QLD/Victorian floods crisis has yet to be priced in (although BOQ/SUN have been dealt some serious blows)

 Read more...
Monday's action - not so quiet....
 |
| Kalgoorlie Superpit - or your trading account if you're not careful |
- BHP closed below 7 day HI EMA, long red candle, local resistance at $46. Medium term weekly trend still intact (from late August 2010), watch for close below $45 in coming days to signal reversal
- CBA Bearish engulfing candle - not unusual in an uptrend, but definite resistance at the $51.50 mark. I am long term bearish on the banks (due to the coming debt deflation) but I can't let this sway my short term trades. Having said that, might be time to add to this call and place a medium term Bear Call Spread (say $54 or $53 lower strike, March/April expiry).
- MQG uptrend with long shadow - KC Signal possible retracement/sideways. Awesome volatility for any long option holder out there (hello!), but I am concerned about a reduction in value if goes sideways from here. Hasn't closed above historical resistance (at approx. $40.25ish). In fact, the recent 1 year daily chart of MQG looks like a simile of the late 2008 to mid-late 2009 chart....
 |
| GFC after-math |
 |
| current activity...although the rebound from the low isn't as dramatic |
- RIO close below 7 HI, long red candle - almost closed below 15 EMA. Seems to be forming a triple top - not many buyers beyond $88 or so. Hmm.
- WBC Bearish engulfing candle - that's it, I'm convinced WBC will stay in a sideways bearish mode for awhile. I'm keeping my March $21/20 BPS (lost 2c per spread contract so far on an initial 13c spread), but will go bearish with either a $23.50 or $24 Bear Call Spread (BCS), probably Feb or March, depending on if I can get filled and if the spread is worth it.
- WOW fast uptrend with long shadow - KC Signal possible retracement/sideways
XJO itself has bounced off the critical 4800 points level again, and I frankly am getting quite frustrated with this!
I have a modest 4700/4650 Bull Put Spread open on XJO at the moment, but according to my defensive action criteria, I will leave it well alone until the sold position doubles in value (one of my specific stop losses).
It might be time to exit my WOW trades (long and BPS) too - although it hasn't triggered any of my exit signals yet, I have a tidy profit so far. Again, I don't take much credence in directional plays on WOW, but I will keep an eye on this - and keep you updated!
As an aside, I believe WOW is one of the best companies in the ASX50, and have heavily researched it as part of my private investing company - Empire Investing (closed to new investors unfortunately!). I also personally invest in WOW through my SMSF (self managed super - come on, start to learn the acroynmns!) using a cash secured put strategy. More on this strategy later, which, combined with what I call a "over-valued" covered call strategy, I intend to adopt as a longer term trading plan for super and possibly, Birch Creek.I will probably add to my hedge on XJO in the coming days, and will be watching the overnight markets for a lead (like everybody else), although the US market is closed for Martin Luther King day.
If Europe appears to be correcting, I will use a 24-hour Index CFD (or Option CFD) as my hedge, although I've never had much luck with CFD's!! (Gold is an exception, but mainly due to following some very good trends last year). As of 6pm local time, WA, the European market is down, on aggregate by 0.5%, mainly due to FTSE and CAC (France).
I follow another watchlist, appropriately called my "Crashlist", which includes the following:
- Australian dollar/US dollar currency pair
- Baltic Dry Index (not much use actually, but interesting to watch)
- 10 year US Treasury yield
- China Shanghai Composite Index
- Dow Jones Industrial Index (USA)
- Euro/US Dollar currency pair
- FTSE 100 Index (UK)
- DAX Index (Germany)
- Gold USD per oz
- Hang Seng Index (Hong Kong)
- Nikkei 225 (Japan)
- NASDAQ Composite (USA)
- S&P 500 Index (USA)
I've tried to put live charts on the bottom of the blog for some of these, but I usually analyse them using my Incredible Charts software. (I use the premium version, a free version is available with delayed data and advertisements, but is more than capable for the infrequent trader)
More on the "Crashlist" and how I use it in other post. For the time being, keep your powder dry and watch this market closely. I think the full effect of the QLD/Victorian floods crisis has yet to be priced in (although BOQ/SUN have been dealt some serious blows)


Sunday, January 16, 2011
0
Sunday, January 16, 2011
Chris Becker
End of Week Market Analysis - 15th January, 2011
The Market The S&P/ASX200 (XJO) closed the week at 4801.4 points, just above its long term resistance of 4800 points. Is it going to repeat the November 5 and December 23 2010 tops and correct falling, or is this a new leg in the re-flation of the Australian stock market?
Observe that the medium term trend line remains intact, on both the weekly (shown below) and daily charts. Price action has stayed resiliently above the 260 day EMA since September 2010.
 There are 2 clear medium/long term support and resistance lines at 4200 and 4800 respectively. The previous 5000 high has not been touched since the May flash crash of 2010. What will it take to see a new bullish leg - what should we look for?
For a sustained, medium term trend, I look for the following:

 The chart opposite shows quarterly momentum, obviously increasing from September lows. Although it has breached the 5% signal line, it has done this before, at both 4800 resistance points. The DMI chart shows a similar tendency to approach its upper signal line, but fail on retracement. This is the major concern, even though price action would suggest a new medium term trend is possible. The daily chart opposite shows the very large bullish candle on Thursday (which happened when your blogger was riding his motorcycle to Perth to get it serviced, and his laptop failed. Damn you Toshiba cr&ppy netbook! At least the coffee in the customer's lounge was good quality...) Using just price action analysis, opportunities abound for selling spreads under the recent moves, given the strong levels of support both short- and medium-term. Until confirmation of new trend, the main signal being subsequent weekly closes above 4800 points, and quarterly momentum EMA above the 5% signal line - I would suggest the following:
On raw price action, the Commonwealth Bank may be forming a cup-and-handle pattern, approaching local resistance at $51.50, with short term support at the psychological key level of $50 (who knows why - people like big round numbers?) and medium term support at $47.50. In the short term, CBA is in a quick upward move, with short-term momentum about to cross its "long" signal line. Again, perhaps the enticement of a very large dividend yield and a "safe" bank (sic) is encouraging new investors - but like WBC, volume doesn't support that thesis. Watch for confirmation of short term uptrend in the coming week, with possible long strategies (e.g $51 Feb call or ATM warrant).


After a very long correction since the May flash crash of 2010 and bottoming in October, it has roared back, displaying a very common pattern - the flat base and has subsequently broken out in a FAST short term uptrend. I'll expand on Macquarie's recent price action and how to spot and use this pattern (see right) in a separate post. MQG has changed its cycle from sideways bearish to bullish, with long term cyclical indicator not yet confirmed by quarterly momentum, but a crossover of the DMI and a weekly close above the 260 day EMA is bullish.  In the short term, MQG is in a short/medium term uptrend, approaching the $40 resistance level (created by the indecision in June-Aug 2010). Secondary indicators suggest continued strength, although the first stage KC Signal (too fast) has been triggered, with possible retracement in days ahead. Given the structural change in MQG's stance, retracements allow for re-entry into a continued breakout (or a lower point of risk in case of bearish change)
As predicted in last week's analysis, BHP continues its sideways bullish stance, with slowing momentum. Price activity still remains above the once $45 resistance, now support level.  Quarterly PDI on the DMI is falling, but quarterly momentum remains above its own EMA and lower signal line. In the short term, BHP is moving around within its continued medium term trend. Failure to close above the previous $46.50 level in the coming week would suggest a good time to take profits. BHP is profiting handsomely from the ridiculous QE2 inflation coming out of the NY Federal Reserve. Watch for volatility in commodity prices (coal, iron ore, gold, crude oil, copper and nickel) in the coming weeks, but QE2 is going to last until March or even June at this stage. Further, the possibility of very large share buybacks by "the big Australian" will likely keep BHP elevated for some time.
 It's struggling to move past resistance at $87.50, but bounces off support at $82. This simple price action suggests use of OTM strangles (e.g $90/$80), but of course, the trader needs to be careful that factors out of his control (e.g QE2 as mentioned above leading to commodity prices bubbles) could cause RIO to jump to $120 or crash to $60 in short time!
At this stage, I would want to keep a close eye on the short term price action, particularly breakouts above $88 or so. RIO could move swiftly up from this level. Recent price action indicates a new short term trend, confirmed by cyclical and directional indicator, although momentum is yet to cross the signal line. (see chart above)  WOW is now on a tear, its "End of Correction" confirmed and then upgraded to "Short Term Uptrend", although Friday's extremely strong bullish candle may mean a small retracement in the coming days. This action is supported by a strong buildup of volume since early January.
 WOW short term trade: Feb $27.50 long ATM call on confirmed medium term trend and/or Feb/Mar $26.50/26 Bull Put Spread
WOW medium term trade: Mar or April $26/25 Bull Put Spread or $26 Cash-secured Put
Read more...
Observe that the medium term trend line remains intact, on both the weekly (shown below) and daily charts. Price action has stayed resiliently above the 260 day EMA since September 2010.

For a sustained, medium term trend, I look for the following:
- a confirmed break out above the historical resistance level - in this case 4800 points.
- all price action above the 260 and 63 day EMA's, with a rising 63 day EMA
- quarterly momentum rising above 5% signal line (and preferably own EMA)
- quarterly Positive DMI, after a recent crossover, rises above its higher signal line


- XJO short term trade: Feb 4700/4650 Bull Put Spread, looking to scale into additional contracts and/or new Feb 4750/4700 as XJO improves.
- XJO medium term trade: Mar 4600/4500 Bull Put Spread and April (when released)
 |
| WBC falling volume.... |

- CBA short term trade: Feb $49.50/49 Bull Put Spread
Westpac has finished its small correction and may be in a small upward move according to short term price action (2 strong closes above short term moving average and 15 EMA, with long tail/Doji cross candle finding support at $22), but all 3 secondary indicators do not confirm an uptrend (see chart below)
Watch for confirmation of short term uptrend in the coming week, with short term bull put spreads ($21.50 or $22 upper strike prices).
- WBC medium term trade: Mar $21/20 Bull Put Spread
Macquarie has a different structural stance to the "Four Pillar" banks.
 |
| from Chartpattern.com |

- MQG short term trade: possible Feb $39 or $39.50 long call, Feb $37.50/$37 Bull Put Spread
MQG medium term trade: Mar or Apr $35/$34 Bull Put Spread
Miners (BHP, RIO)

- BHP short term trade: take profits on any long trades if price fails to close above $46.50 target next week
- BHP medium term trade: March or April $42/41 Bull Put Spread
RIO has effectively been a sideways bullish stance since early November 2010, although the pattern does resemble a strong bull flat base (see MQG above).
 |
| Momentum (top) not confirmed |
- RIO short term trade: Feb $84/83 Bull Put Spread on confirmation (short term momentum)
- RIO medium term trade: possible long ATM call for short/medium term breakout from flat base

As mentioned in my post on WOW, watch for a sustained move on the PDI on the DMS above 30, support on the quarterly momentum and directional indicators to confirm that medium trend, and then hold on!!
Monday, January 10, 2011
0
Monday, January 10, 2011
Chris Becker
End of Week Market Analysis - 8th January 2011
The Market
The ASX200 (XJO) is still in a sideways bullish holding pattern. The trend line, from a low at 4182 on 6 July 2010 through to the accumulation zone in late November, early December 2010 has been respected after a small, weak correction since the start of 2011.
 There is very firm resistance at 4800 points, and similar strength of support at (intra-day) 4550 and (closing) 4600.
Secondary indicators suggest continued weakness to the upside, with nothing confirming or suggesting a sustained upward trend - past 4800 - at this time.
However, recent price action in the last week, which is somewhat oversold, suggests a possible short-term trend, with a target of 4800 points (resistance).
The XJO remains cyclical at best, a medium term strangle (4850+/4500-) or OTM Bear Put Spread appear to be the best trading opportunities at this time.
Banks
CBA and WBC have remained in a structural Sideways Bearish pattern since May 2010. This is endemic of the so-called "Big Four" banks.
CBA has recently undergone a short term correction which appears to be running out of puff at just below $50 per share, although the Negative DI on the Directional Movement has not confirmed the end of the downward move, staying above its signal line.
Although CBA remains in an overall bearish position, both in the short and medium term, support may be gathering coming up to earnings season. It has a net dividend yield of 6.1%.
Suggested trade: stand aside until "End of Correction" or "Short Term Uptrend" price action is confirmed. Possible medium term OTM Bear Put Spread at $52-$53 area.
WBC's price action is very similar although its correction (from a high of $23.20 to almost $22) has been longer than CBA with a pause at $22.60/70 area, before finding support at $22.
And similarly, WBC is still bearish in both timeframes, with Negative DI still well above its signal line and negative momentum still in place. There has been no short trend cyclical change with WBC yet.
Suggested trade: as above, stand aside until price action is identified and confirmed.
Miners
BHP is driving this market with a medium term trend from late August, 2010 still in place, with a support trendline in the $44.50 area. Momentum is slowing down, and the main cycle is indicating a possible correction or sideways action in the weeks ahead.
In the short term, BHP has had a mild correction after hitting a near Xmas high of $46.48. The current price activity could be somewhat oversold, particularly if BHP respects its medium term EMA and weekly trendline.
Suggested trade: "End of Correction" on confirmation: $44 or $44.40 upper strike Bull Put Spread
RIO is also driving alongside BHP having risen almost a third since its $65 low in July 2010. It has gone sideways since reaching a frothy $88 high in mid-November 2010 with two subsequent corrections and a small and short uptrend. Resistance at $88 appears to have set in the mind of the market.
In the current correction/sideways bear move, RIO is approaching its medium term EMA (approx. $84). A close below this level would suggest a large down move, but all secondary indicators are oversold.
Suggested trade: "End of Correction" on confirmation: $84 upper strike Bull Put Spread
Woolworths (WOW)
WOW is consolidating in its nearly 3 year old trading channel after reaching a high of $30 on October 7, 2010. Price bounced off the new higher support level of $26 after the October correction and has returned there again after a lacklustre Xmas trading period.

In the short term, expect WOW to bounce off the $26 support for a "End of Correction" price action, but with continued sideways weakness.
Suggested trade (if confirmed by secondary indicators): Bull Put Spread at $26 upper strike
All chart image screenshots from Incredible Charts.
Read more...
The ASX200 (XJO) is still in a sideways bullish holding pattern. The trend line, from a low at 4182 on 6 July 2010 through to the accumulation zone in late November, early December 2010 has been respected after a small, weak correction since the start of 2011.

Secondary indicators suggest continued weakness to the upside, with nothing confirming or suggesting a sustained upward trend - past 4800 - at this time.
However, recent price action in the last week, which is somewhat oversold, suggests a possible short-term trend, with a target of 4800 points (resistance).
The XJO remains cyclical at best, a medium term strangle (4850+/4500-) or OTM Bear Put Spread appear to be the best trading opportunities at this time.
Banks
CBA and WBC have remained in a structural Sideways Bearish pattern since May 2010. This is endemic of the so-called "Big Four" banks.
 |
| CBA weekly price since May 2010 |
CBA has recently undergone a short term correction which appears to be running out of puff at just below $50 per share, although the Negative DI on the Directional Movement has not confirmed the end of the downward move, staying above its signal line.
Although CBA remains in an overall bearish position, both in the short and medium term, support may be gathering coming up to earnings season. It has a net dividend yield of 6.1%.
Suggested trade: stand aside until "End of Correction" or "Short Term Uptrend" price action is confirmed. Possible medium term OTM Bear Put Spread at $52-$53 area.
 |
| WBC finding support? |
And similarly, WBC is still bearish in both timeframes, with Negative DI still well above its signal line and negative momentum still in place. There has been no short trend cyclical change with WBC yet.
Suggested trade: as above, stand aside until price action is identified and confirmed.
Miners
BHP is driving this market with a medium term trend from late August, 2010 still in place, with a support trendline in the $44.50 area. Momentum is slowing down, and the main cycle is indicating a possible correction or sideways action in the weeks ahead.
 |
| BHP still rising? |
In the short term, BHP has had a mild correction after hitting a near Xmas high of $46.48. The current price activity could be somewhat oversold, particularly if BHP respects its medium term EMA and weekly trendline.
Suggested trade: "End of Correction" on confirmation: $44 or $44.40 upper strike Bull Put Spread
RIO is also driving alongside BHP having risen almost a third since its $65 low in July 2010. It has gone sideways since reaching a frothy $88 high in mid-November 2010 with two subsequent corrections and a small and short uptrend. Resistance at $88 appears to have set in the mind of the market.
In the current correction/sideways bear move, RIO is approaching its medium term EMA (approx. $84). A close below this level would suggest a large down move, but all secondary indicators are oversold.
Suggested trade: "End of Correction" on confirmation: $84 upper strike Bull Put Spread
Woolworths (WOW)
WOW is consolidating in its nearly 3 year old trading channel after reaching a high of $30 on October 7, 2010. Price bounced off the new higher support level of $26 after the October correction and has returned there again after a lacklustre Xmas trading period.

In the short term, expect WOW to bounce off the $26 support for a "End of Correction" price action, but with continued sideways weakness.
Suggested trade (if confirmed by secondary indicators): Bull Put Spread at $26 upper strike
All chart image screenshots from Incredible Charts.
Subscribe to:
Posts (Atom)