
Monday, January 24, 2011
2
Monday, January 24, 2011
Chris Becker
 Well, three of my favourite bloggers:
In their own words:
I think they will eventually form a better alternative to the major aggregator of financial news and opinion, Business Spectator.
I have changed my blogroll to reflect the amalgamation and wish them all the best. For those of you who still watch/listen the major commentators on the mainstream press (e.g AFR, Channel 7/9/10, The Age, The Aussie etc ad nauseam), for shame!!!!
Read more...
New Superblog - Macrobusiness.com.au

- Houses and Holes - by David Lwellyn-Smith (formerly of Business Spectator)
- The Unconventional Economist - by economist Leith van Onselen
- Delusional Economics
In their own words:
MacroBusiness was formed by four bloggers who reckon the gap between the Australian business media and reality has widened to a gulf.That this is possible without the heavy-hand of a dictator is testament to the power of vested interests, monopolies, weak government, closed ideologies and a perennial culture of populism.In effect, it means our leadership class can make unaccountable economic and business blunders, or, they are measured against entirely inappropriate yardsticks.At MacroBusiness we use reason, history and ideas to bring you a bigger picture of the choices we face for our economy, businesses and investments.We are the hedge fund of Australian business media.
I think they will eventually form a better alternative to the major aggregator of financial news and opinion, Business Spectator.
I have changed my blogroll to reflect the amalgamation and wish them all the best. For those of you who still watch/listen the major commentators on the mainstream press (e.g AFR, Channel 7/9/10, The Age, The Aussie etc ad nauseam), for shame!!!!
Friday, January 21, 2011
2
Friday, January 21, 2011
Chris Becker
Its very very qwuiet...and a road to nowhere...
Sorry for the lack of posts/content, I've been busier than a one-armed bricklayer in Baghdad, putting/closing trades amongst this current action AND developing a new website for my investment company (still in test phase) .
And if you haven't noticed, I've also made some changes here - wasn't happy with the standard template so went out and modified a Wordpress one and here we are!

Read more...
And if you haven't noticed, I've also made some changes here - wasn't happy with the standard template so went out and modified a Wordpress one and here we are!

In the midst of all this, my wife and I are moving house (going back to soggy Queensland) and planning a loooooong trip - we are driving/riding across Australia, from Bunbury WA to Hervey Bay QLD, about 4900kms.
We leave on February 1st and will arrive Feb. 10th or 11th. I'll still be trading and online - intermittently, but enjoying the trip nonetheless, because flying stinks!
Monday, January 17, 2011
0
Monday, January 17, 2011
Chris Becker
A very poor day today on the XJO - down 38 points or 0.8%, due to most of below:
XJO itself has bounced off the critical 4800 points level again, and I frankly am getting quite frustrated with this!
I have a modest 4700/4650 Bull Put Spread open on XJO at the moment, but according to my defensive action criteria, I will leave it well alone until the sold position doubles in value (one of my specific stop losses).
It might be time to exit my WOW trades (long and BPS) too - although it hasn't triggered any of my exit signals yet, I have a tidy profit so far. Again, I don't take much credence in directional plays on WOW, but I will keep an eye on this - and keep you updated!
If Europe appears to be correcting, I will use a 24-hour Index CFD (or Option CFD) as my hedge, although I've never had much luck with CFD's!! (Gold is an exception, but mainly due to following some very good trends last year). As of 6pm local time, WA, the European market is down, on aggregate by 0.5%, mainly due to FTSE and CAC (France).
I follow another watchlist, appropriately called my "Crashlist", which includes the following:
I've tried to put live charts on the bottom of the blog for some of these, but I usually analyse them using my Incredible Charts software. (I use the premium version, a free version is available with delayed data and advertisements, but is more than capable for the infrequent trader)
More on the "Crashlist" and how I use it in other post. For the time being, keep your powder dry and watch this market closely. I think the full effect of the QLD/Victorian floods crisis has yet to be priced in (although BOQ/SUN have been dealt some serious blows)

 Read more...
Monday's action - not so quiet....
 |
| Kalgoorlie Superpit - or your trading account if you're not careful |
- BHP closed below 7 day HI EMA, long red candle, local resistance at $46. Medium term weekly trend still intact (from late August 2010), watch for close below $45 in coming days to signal reversal
- CBA Bearish engulfing candle - not unusual in an uptrend, but definite resistance at the $51.50 mark. I am long term bearish on the banks (due to the coming debt deflation) but I can't let this sway my short term trades. Having said that, might be time to add to this call and place a medium term Bear Call Spread (say $54 or $53 lower strike, March/April expiry).
- MQG uptrend with long shadow - KC Signal possible retracement/sideways. Awesome volatility for any long option holder out there (hello!), but I am concerned about a reduction in value if goes sideways from here. Hasn't closed above historical resistance (at approx. $40.25ish). In fact, the recent 1 year daily chart of MQG looks like a simile of the late 2008 to mid-late 2009 chart....
 |
| GFC after-math |
 |
| current activity...although the rebound from the low isn't as dramatic |
- RIO close below 7 HI, long red candle - almost closed below 15 EMA. Seems to be forming a triple top - not many buyers beyond $88 or so. Hmm.
- WBC Bearish engulfing candle - that's it, I'm convinced WBC will stay in a sideways bearish mode for awhile. I'm keeping my March $21/20 BPS (lost 2c per spread contract so far on an initial 13c spread), but will go bearish with either a $23.50 or $24 Bear Call Spread (BCS), probably Feb or March, depending on if I can get filled and if the spread is worth it.
- WOW fast uptrend with long shadow - KC Signal possible retracement/sideways
XJO itself has bounced off the critical 4800 points level again, and I frankly am getting quite frustrated with this!
I have a modest 4700/4650 Bull Put Spread open on XJO at the moment, but according to my defensive action criteria, I will leave it well alone until the sold position doubles in value (one of my specific stop losses).
It might be time to exit my WOW trades (long and BPS) too - although it hasn't triggered any of my exit signals yet, I have a tidy profit so far. Again, I don't take much credence in directional plays on WOW, but I will keep an eye on this - and keep you updated!
As an aside, I believe WOW is one of the best companies in the ASX50, and have heavily researched it as part of my private investing company - Empire Investing (closed to new investors unfortunately!). I also personally invest in WOW through my SMSF (self managed super - come on, start to learn the acroynmns!) using a cash secured put strategy. More on this strategy later, which, combined with what I call a "over-valued" covered call strategy, I intend to adopt as a longer term trading plan for super and possibly, Birch Creek.I will probably add to my hedge on XJO in the coming days, and will be watching the overnight markets for a lead (like everybody else), although the US market is closed for Martin Luther King day.
If Europe appears to be correcting, I will use a 24-hour Index CFD (or Option CFD) as my hedge, although I've never had much luck with CFD's!! (Gold is an exception, but mainly due to following some very good trends last year). As of 6pm local time, WA, the European market is down, on aggregate by 0.5%, mainly due to FTSE and CAC (France).
I follow another watchlist, appropriately called my "Crashlist", which includes the following:
- Australian dollar/US dollar currency pair
- Baltic Dry Index (not much use actually, but interesting to watch)
- 10 year US Treasury yield
- China Shanghai Composite Index
- Dow Jones Industrial Index (USA)
- Euro/US Dollar currency pair
- FTSE 100 Index (UK)
- DAX Index (Germany)
- Gold USD per oz
- Hang Seng Index (Hong Kong)
- Nikkei 225 (Japan)
- NASDAQ Composite (USA)
- S&P 500 Index (USA)
I've tried to put live charts on the bottom of the blog for some of these, but I usually analyse them using my Incredible Charts software. (I use the premium version, a free version is available with delayed data and advertisements, but is more than capable for the infrequent trader)
More on the "Crashlist" and how I use it in other post. For the time being, keep your powder dry and watch this market closely. I think the full effect of the QLD/Victorian floods crisis has yet to be priced in (although BOQ/SUN have been dealt some serious blows)


0
Chris Becker
 I contend that the exit is more important than the entry. This insight took almost 2 years of trading time to understand!
In this post, I'm going to show you my technique for how I exit a "long" (i.e have bought to profit from price going up) short term and medium term trade.
Please note that this method works well on my "Seven" - I know it doesn't work well on mining stocks outside of the ASX100 or 200, which have different volatilities than the "blue chips". This methodology also only works in the current sideways market environment - you have to adopt new techniques for outright bull markets.
There are 3 schools of thought with taking profits: don't (buy and hope), sell into strength (i.e sell on a good strong up-day) or ride trend until it tells you to get off. I do the last as much as possible, but sometimes I go with my gut feeling and sell into strength. So far this hasn't worked out, as I've left lots of profit on the table, so I've structured my sell to be as disciplined as possible.
My Methods
Short term trend - I'm trading a short term trend, and have been riding the trend for about 5-10 days. I'm sitting on an okay profit, but am wary about future price action. My "sell-sell-sell" internal indicator (my gut) tells me I need to take a profit, but what does the price tell me?
The biggest sticking point is seeing a down "red"-candle day on your charts - say the price dropped 0.5 or even 1% or more in a day? Should you get out? If this happens, I look at the following four signals:
If all four signals occur, I exit. This works about 75-80% of the time and subsequent price action confirms I covered my profit at a good time. Unfortunately, sometimes it will rebound the following day.
Medium term trend - as above, but I add a fifth signal, with a close below the 15 day EMA. Again, sometimes this doesn't work and the trend starts again after a short correction. As I only watch 7 stocks, I am watching for these new opportunities, and have time to analyse the long term price action, which may still indicate a structural uptrend is still in place. There is no crime or shame in re-entering a trend after you have exited. The markets are amoral on this point.
A sidenote on indicators: these work for me as I have a low tolerance for holding periods (I average less than 20 days on directional trades), but may not work for other stocks or strategies. I have other systems I watch in parallel, as I get ready for markets to change behaviour. Current price activity (since around August 2009) is very hard to trade from the directional side - this may change in the months and year's ahead!
Price Patterns
There are distinct price patterns that can also indicate the end of the trend. I will cover two here: the bearish engulfing candle and the "inflation" pattern.
The "inflated" price pattern, which resembles an arc - works on both short term and very long term price activity, as it is a direct reflection of the participants. It usually starts with a breakout from a previous correction and then the "bubble" is pumped full of air before reaching a flat-line point.
The classic "inflation" is March 2009 to May 2009 (see the Dow Jones chart below). This fits a curve very nicely - remember to use semi-log scale charts, not simple linear charts for long term analysis. I only use linear scale on less than 3 months daily charts (but not for options, which can leap several hundred percent in days).
But this pattern works well on very short term activity too. The chart (below) shows a recent short term trend for Commonwealth Bank (CBA). The blue and red lines are the 7 day EMA, but based on high and low of the day respectively.
The black line is a fitted curve showing the "inflation". Of course, this can only be fitted perfectly, after the fact, but during a trend gives a good indication of current price action.
The crest of this pattern is known as an ascending triangle (see above), usually quite bullish. Indeed, price may go sideways for a while and then breakout and start a new, more linear trend.
What you are witnessing - in both the short and long term - is the behaviour of market participants, which may or may not be a reflection of fundamentals. Its all perception - what I do is read perception.
 Bearish engulfing candle - (see diagram right) - is very easy to explain. A quick primer on candles, they are just a fancy way of showing the high (upper "wick"), the low (lower "wick"), the open and close of that day's (or week or month) price action. If its a down day you get a black or red candle, and the top is the open, the bottom of the candle is the close. For an up day, vice versa (white or blue).
With the bearish candle, you are witnessing a new opening high, but then sentiment changes during the day and a sell-off begins. Finally, the low of the day is below the previous day's open (and low), "engulfing" all price action.
I don't like to rely solely on single day price action, but in this case, the bearish engulfing pattern does work extremely well. Combined with my above four (or five for medium trends) its a clear signal to get out of town.
Summary
Exiting a trade is more important than the entry - this is where you make your money on directional trades. Picking tops and bottoms is best left for monkeys, although the occasional monkey can profit using other strategies from time to time.
Don't feel bad if you exit early and then watch the price shoot up again. Re-enter. There is no shame in this: you have not misread the prevailing behaviour of the participants, but the non-participants. Think of it this way, there might be some on the sidelines watching a new trend develop, are cautious about entering, and then take the opportunity when there is a modest sell-off.
I know this - because its a major strategy I use to enter trades for my super fund, where my time horizon is much longer. Keep this in mind and don't beat yourself up if you watch the trade runaway!
Read more...
Exiting a trade

In this post, I'm going to show you my technique for how I exit a "long" (i.e have bought to profit from price going up) short term and medium term trade.
Please note that this method works well on my "Seven" - I know it doesn't work well on mining stocks outside of the ASX100 or 200, which have different volatilities than the "blue chips". This methodology also only works in the current sideways market environment - you have to adopt new techniques for outright bull markets.
There are 3 schools of thought with taking profits: don't (buy and hope), sell into strength (i.e sell on a good strong up-day) or ride trend until it tells you to get off. I do the last as much as possible, but sometimes I go with my gut feeling and sell into strength. So far this hasn't worked out, as I've left lots of profit on the table, so I've structured my sell to be as disciplined as possible.
My Methods
Short term trend - I'm trading a short term trend, and have been riding the trend for about 5-10 days. I'm sitting on an okay profit, but am wary about future price action. My "sell-sell-sell" internal indicator (my gut) tells me I need to take a profit, but what does the price tell me?
The biggest sticking point is seeing a down "red"-candle day on your charts - say the price dropped 0.5 or even 1% or more in a day? Should you get out? If this happens, I look at the following four signals:
- close breaks uptrend line
- close below 7 day LO-EMA (more on this below)
- short term momentum closes below own smoothed average and/or 2% signal line
- short term cyclical was above 100 (which indicates a continued trend), and then turns below 50
If all four signals occur, I exit. This works about 75-80% of the time and subsequent price action confirms I covered my profit at a good time. Unfortunately, sometimes it will rebound the following day.
Medium term trend - as above, but I add a fifth signal, with a close below the 15 day EMA. Again, sometimes this doesn't work and the trend starts again after a short correction. As I only watch 7 stocks, I am watching for these new opportunities, and have time to analyse the long term price action, which may still indicate a structural uptrend is still in place. There is no crime or shame in re-entering a trend after you have exited. The markets are amoral on this point.
A sidenote on indicators: these work for me as I have a low tolerance for holding periods (I average less than 20 days on directional trades), but may not work for other stocks or strategies. I have other systems I watch in parallel, as I get ready for markets to change behaviour. Current price activity (since around August 2009) is very hard to trade from the directional side - this may change in the months and year's ahead!
Price Patterns
There are distinct price patterns that can also indicate the end of the trend. I will cover two here: the bearish engulfing candle and the "inflation" pattern.
The "inflated" price pattern, which resembles an arc - works on both short term and very long term price activity, as it is a direct reflection of the participants. It usually starts with a breakout from a previous correction and then the "bubble" is pumped full of air before reaching a flat-line point.
The classic "inflation" is March 2009 to May 2009 (see the Dow Jones chart below). This fits a curve very nicely - remember to use semi-log scale charts, not simple linear charts for long term analysis. I only use linear scale on less than 3 months daily charts (but not for options, which can leap several hundred percent in days).
 |
| The "Bernanke" curve - a classic reflation. |
But this pattern works well on very short term activity too. The chart (below) shows a recent short term trend for Commonwealth Bank (CBA). The blue and red lines are the 7 day EMA, but based on high and low of the day respectively.
 |
| note fit of curved (black) line and 7 LO (red line) |
 |
| from Chartpattern.com |
What you are witnessing - in both the short and long term - is the behaviour of market participants, which may or may not be a reflection of fundamentals. Its all perception - what I do is read perception.
 Bearish engulfing candle - (see diagram right) - is very easy to explain. A quick primer on candles, they are just a fancy way of showing the high (upper "wick"), the low (lower "wick"), the open and close of that day's (or week or month) price action. If its a down day you get a black or red candle, and the top is the open, the bottom of the candle is the close. For an up day, vice versa (white or blue).
With the bearish candle, you are witnessing a new opening high, but then sentiment changes during the day and a sell-off begins. Finally, the low of the day is below the previous day's open (and low), "engulfing" all price action.
I don't like to rely solely on single day price action, but in this case, the bearish engulfing pattern does work extremely well. Combined with my above four (or five for medium trends) its a clear signal to get out of town.
Summary
Exiting a trade is more important than the entry - this is where you make your money on directional trades. Picking tops and bottoms is best left for monkeys, although the occasional monkey can profit using other strategies from time to time.
Don't feel bad if you exit early and then watch the price shoot up again. Re-enter. There is no shame in this: you have not misread the prevailing behaviour of the participants, but the non-participants. Think of it this way, there might be some on the sidelines watching a new trend develop, are cautious about entering, and then take the opportunity when there is a modest sell-off.
I know this - because its a major strategy I use to enter trades for my super fund, where my time horizon is much longer. Keep this in mind and don't beat yourself up if you watch the trade runaway!
0
Chris Becker
 It took just over a week to get 500 page-views for Birch Creek Trading!
Thank you for having a look and I hope everyone is gaining an insight. Right now, I haven't closed any trades I have opened since starting the blog, so the "guts" of the blog is yet to make an appearance. Watch this space as I hopefully make only a few mistakes, but lots of profit.....
I've updated the page "Trades" (see the tabs at the top of the blog, e.g. What I Trade, My Routine) - it now includes a table summary of all trades I have outlined in my End of Week analysis and individual "Magnificent Seven" analysis.
From there you can track if my trading strategies work well or not - I have kept the "tracking" quite simple, with identical capital allocation for each trade: either 1 option contract (exposure to 1000 shares), 500 warrants (assume 50% leverage for total 1000 shares exposure) or 1000 shares.
Of course, capital allocation is a large component of trading due to the "equity at risk" rule. Most traders use 2% total equity at risk: I vary it depending on the inherent risk of the trading vehicle.
My actual trades will differ slightly from the table summary: why?
Because I trade first and blog later! I might in the post-close afternoon analysis give some reasons to trade ZXY, but I may have already performed such a trade myself.
Almost two hours left in the day and XJO is falling - it seems 4800 remains key resistance for the time being.....
Read more...
500 views and "Trades" page update
Thank you for having a look and I hope everyone is gaining an insight. Right now, I haven't closed any trades I have opened since starting the blog, so the "guts" of the blog is yet to make an appearance. Watch this space as I hopefully make only a few mistakes, but lots of profit.....
I've updated the page "Trades" (see the tabs at the top of the blog, e.g. What I Trade, My Routine) - it now includes a table summary of all trades I have outlined in my End of Week analysis and individual "Magnificent Seven" analysis.
From there you can track if my trading strategies work well or not - I have kept the "tracking" quite simple, with identical capital allocation for each trade: either 1 option contract (exposure to 1000 shares), 500 warrants (assume 50% leverage for total 1000 shares exposure) or 1000 shares.
Of course, capital allocation is a large component of trading due to the "equity at risk" rule. Most traders use 2% total equity at risk: I vary it depending on the inherent risk of the trading vehicle.
My actual trades will differ slightly from the table summary: why?
Because I trade first and blog later! I might in the post-close afternoon analysis give some reasons to trade ZXY, but I may have already performed such a trade myself.
Almost two hours left in the day and XJO is falling - it seems 4800 remains key resistance for the time being.....
0
Chris Becker
 The table below summarises all trades on this blog (from End of Week Market Analysis and individual security summaries) mentioned in End of Week Market Analysis.
Accumulative Profit as of 17th January is $399 per option contract/500 warrants/1000 shares.
Notes to Table:
Read more...
My Trades - as of 17th January, 2011
 The table below summarises all trades on this blog (from End of Week Market Analysis and individual security summaries) mentioned in End of Week Market Analysis.
Accumulative Profit as of 17th January is $399 per option contract/500 warrants/1000 shares.
Blog Date | Trade | Confirmation | Codes | Exit Date | Profit/Loss | Accumulative Profit |
10-Jan-11 | XJO Feb 4700/4650 BPS | 10-Jan-11 | TN7/TM7 | $180 | $180 | |
XJO Mar 4900/4500 Strangle | 10-Jan-11 | UB8/U28 | $1,000 | $1,180 | ||
BHP Feb $44/43 BPS | 12-Jan-11 | EZ7/K27 | $240 | $1,420 | ||
RIO Feb $84/83 BPS | 13-Jan-11 | TK9/CF7 | $180 | $1,600 | ||
WOW Feb $26/25 BPS | 11-Jan-11 | V58/V18 | $135 | $1,735 | ||
15-Jan-11 | XJO Feb 4700/4650 BPS | 14-Jan-11 | TN7/TM7 | $100 | $1,835 | |
XJO Mar 4600/4500 BPS | 14-Jan-11 | U58/U28 | $174 | $2,009 | ||
CBA Feb $49.50/49 BPS | 14-Jan-11 | FK8/UF7 | $170 | $2,179 | ||
WBC Feb $22/21.50 BPS | NYC | LT9/LP9 | $2,179 | |||
WBC Mar $21/20 BPS | 14-Jan-11 | FI8/FH8 | $130 | $2,309 | ||
MQG Feb $39 long call | 17-Jan-11 | SQ7 | -$1,970 | $339 | ||
MQG Feb $37.50/37 BPS | 14-Jan-11 | NU7/NY7 | $80 | $419 | ||
MQG Mar $35/34 BPS | 14-Jan-11 | Z29/Z19 | $75 | $494 | ||
BHP Mar $42/41 BPS | 14-Jan-11 | Z28/YX8 | $120 | $614 | ||
RIO Feb $84/83 BPS | 14-Jan-11 | TK9/CF7 | $260 | $874 | ||
WOW Feb $27.50 long call | 17-Jan-11 | R58 | $45 | $219 | ||
WOW Feb $26.50/26 BPS | 14-Jan-11 | QX8/V58 | $65 | $239 | ||
WOW Mar $26/25 BPS | 14-Jan-11 | FQ8/FP8 | $160 | $399 | ||
Legend:
- BPS - Bull Put Spread
- BCS - Bear Call Spread
- Blog Entry Date - date suggested trade was mentioned
- Confirmation Date - date when trade was opened, on confirmation of entry signal.
- Currently open trades obviously have no "Exit Date" entry, but initial profit (premium on entry) or loss (capital allocated, e.g shares bought) is calculated
- Entry and exit price are calculated from closing price on Confirmation Date
- Profit/loss is calculated per option contract (1 XJO point is $10, 1 equity option cent per contract is also $10 - 1000 shares per contract) or per 1000 shares or 500 warrants (assumed leverage of 50%).
- A long call or put has an immediate "loss" as a debit is made, whilst a sold call or put or credit spread has an immediate "profit". Final profit/loss is calculated on exit.
- No brokerage, ACH fees, slippage (buy/sell spread) or liquidity/fill problems are assumed or calculated.
For ease of calculation, I have not calculated Return on Assets (ROA) due to margin requirements on sold option positions or varying interest rates on warrants, or any interest on cash held in account.
Important Information:
The content, information and any advertisements of this blog should not be taken as investment advice nor a recommendation to buy or sell, or utilise any strategy mentioned. The author may or may not have a underlying position or is considering a position in any or all of the securities or strategies mentioned. You are responsible for the outcome of your own actions, seek advice before investing or trading your own capital.
0
Chris Becker
Is gold/silver entering the 3rd "Mania" phase of a bull market? (LINK)
Extensive article and research on the price behaviour of gold/silver leading from the Bullion Baron:Is Gold/silver entering the 3rd phase of a bull market?
Please read in full, as it gives great insight into bubble like behaviour.
Consider this much quoted chart of bubble behaviour:
 Although gold recently corrected from its all time high to $1365 or so (look at the bottom of this blog for a series of 24 hour charts and link to Kitco - my favourite precious metals trading/investing site for longer term data and analysis), this maybe another retracement point for serious buyers (speculators) to re-open or add to positions.
2011 is going to be an interesting year - the two main "events" being the continued European debt crisis/minefield and the continued ridiculous $1 trillion plus fiscal deficits of the US.
The interesting point with gold is this: its worth is extremely highly correlated with central bank set interest rates. Will gold's value plummet like it did in the last bubble of the 1970s because central banks are forced to raised interest rates due to a lack of buying of government bonds and/or to put a damper on monetary-stimulus induced inflation? (e.g Volker in the early 1980's)
The paradox is if they do raise rates, governments around the world will struggle to actually service that debt (i.e Japan, the US, most of Europe) and need either more borrowing (selling of bonds) or more money printing. Both of these act as a floor under gold - as it cannot be borrowed/printed into existence.
Read more...
Please read in full, as it gives great insight into bubble like behaviour.
Consider this much quoted chart of bubble behaviour:

2011 is going to be an interesting year - the two main "events" being the continued European debt crisis/minefield and the continued ridiculous $1 trillion plus fiscal deficits of the US.
The interesting point with gold is this: its worth is extremely highly correlated with central bank set interest rates. Will gold's value plummet like it did in the last bubble of the 1970s because central banks are forced to raised interest rates due to a lack of buying of government bonds and/or to put a damper on monetary-stimulus induced inflation? (e.g Volker in the early 1980's)
The paradox is if they do raise rates, governments around the world will struggle to actually service that debt (i.e Japan, the US, most of Europe) and need either more borrowing (selling of bonds) or more money printing. Both of these act as a floor under gold - as it cannot be borrowed/printed into existence.
Sunday, January 16, 2011
0
Sunday, January 16, 2011
Chris Becker
End of Week Market Analysis - 15th January, 2011
The Market The S&P/ASX200 (XJO) closed the week at 4801.4 points, just above its long term resistance of 4800 points. Is it going to repeat the November 5 and December 23 2010 tops and correct falling, or is this a new leg in the re-flation of the Australian stock market?
Observe that the medium term trend line remains intact, on both the weekly (shown below) and daily charts. Price action has stayed resiliently above the 260 day EMA since September 2010.
 There are 2 clear medium/long term support and resistance lines at 4200 and 4800 respectively. The previous 5000 high has not been touched since the May flash crash of 2010. What will it take to see a new bullish leg - what should we look for?
For a sustained, medium term trend, I look for the following:

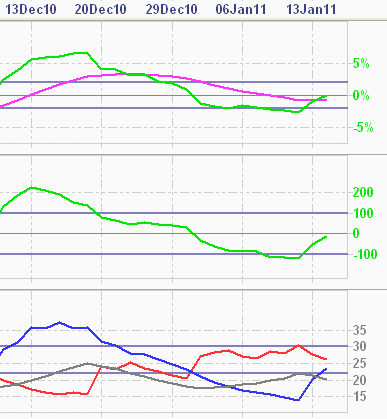
 The chart opposite shows quarterly momentum, obviously increasing from September lows. Although it has breached the 5% signal line, it has done this before, at both 4800 resistance points. The DMI chart shows a similar tendency to approach its upper signal line, but fail on retracement. This is the major concern, even though price action would suggest a new medium term trend is possible. The daily chart opposite shows the very large bullish candle on Thursday (which happened when your blogger was riding his motorcycle to Perth to get it serviced, and his laptop failed. Damn you Toshiba cr&ppy netbook! At least the coffee in the customer's lounge was good quality...) Using just price action analysis, opportunities abound for selling spreads under the recent moves, given the strong levels of support both short- and medium-term. Until confirmation of new trend, the main signal being subsequent weekly closes above 4800 points, and quarterly momentum EMA above the 5% signal line - I would suggest the following:
On raw price action, the Commonwealth Bank may be forming a cup-and-handle pattern, approaching local resistance at $51.50, with short term support at the psychological key level of $50 (who knows why - people like big round numbers?) and medium term support at $47.50. In the short term, CBA is in a quick upward move, with short-term momentum about to cross its "long" signal line. Again, perhaps the enticement of a very large dividend yield and a "safe" bank (sic) is encouraging new investors - but like WBC, volume doesn't support that thesis. Watch for confirmation of short term uptrend in the coming week, with possible long strategies (e.g $51 Feb call or ATM warrant).


After a very long correction since the May flash crash of 2010 and bottoming in October, it has roared back, displaying a very common pattern - the flat base and has subsequently broken out in a FAST short term uptrend. I'll expand on Macquarie's recent price action and how to spot and use this pattern (see right) in a separate post. MQG has changed its cycle from sideways bearish to bullish, with long term cyclical indicator not yet confirmed by quarterly momentum, but a crossover of the DMI and a weekly close above the 260 day EMA is bullish.  In the short term, MQG is in a short/medium term uptrend, approaching the $40 resistance level (created by the indecision in June-Aug 2010). Secondary indicators suggest continued strength, although the first stage KC Signal (too fast) has been triggered, with possible retracement in days ahead. Given the structural change in MQG's stance, retracements allow for re-entry into a continued breakout (or a lower point of risk in case of bearish change)
As predicted in last week's analysis, BHP continues its sideways bullish stance, with slowing momentum. Price activity still remains above the once $45 resistance, now support level.  Quarterly PDI on the DMI is falling, but quarterly momentum remains above its own EMA and lower signal line. In the short term, BHP is moving around within its continued medium term trend. Failure to close above the previous $46.50 level in the coming week would suggest a good time to take profits. BHP is profiting handsomely from the ridiculous QE2 inflation coming out of the NY Federal Reserve. Watch for volatility in commodity prices (coal, iron ore, gold, crude oil, copper and nickel) in the coming weeks, but QE2 is going to last until March or even June at this stage. Further, the possibility of very large share buybacks by "the big Australian" will likely keep BHP elevated for some time.
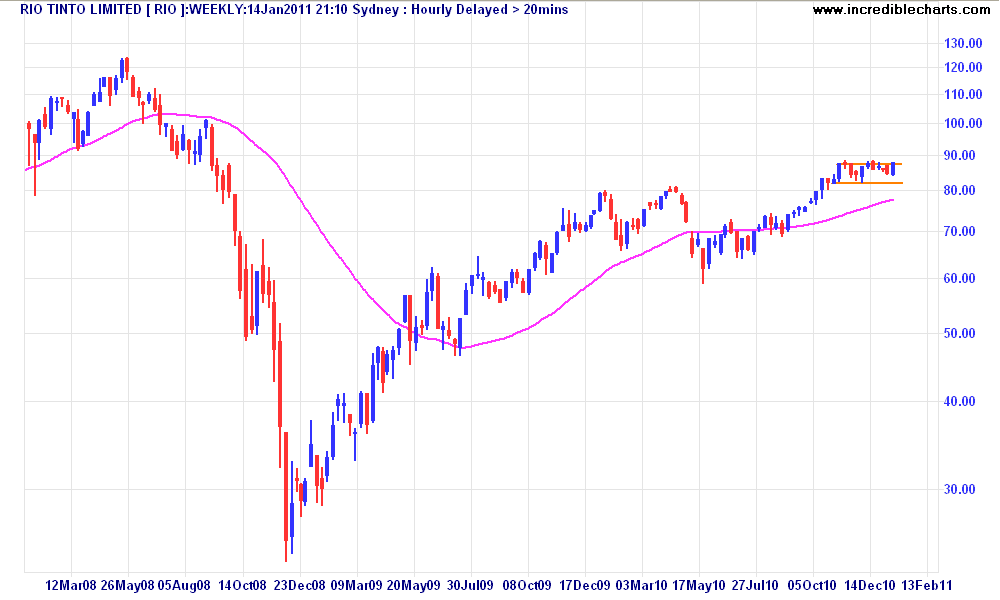
 It's struggling to move past resistance at $87.50, but bounces off support at $82. This simple price action suggests use of OTM strangles (e.g $90/$80), but of course, the trader needs to be careful that factors out of his control (e.g QE2 as mentioned above leading to commodity prices bubbles) could cause RIO to jump to $120 or crash to $60 in short time!
At this stage, I would want to keep a close eye on the short term price action, particularly breakouts above $88 or so. RIO could move swiftly up from this level. Recent price action indicates a new short term trend, confirmed by cyclical and directional indicator, although momentum is yet to cross the signal line. (see chart above)  WOW is now on a tear, its "End of Correction" confirmed and then upgraded to "Short Term Uptrend", although Friday's extremely strong bullish candle may mean a small retracement in the coming days. This action is supported by a strong buildup of volume since early January.
 WOW short term trade: Feb $27.50 long ATM call on confirmed medium term trend and/or Feb/Mar $26.50/26 Bull Put Spread
WOW medium term trade: Mar or April $26/25 Bull Put Spread or $26 Cash-secured Put
Read more...
Observe that the medium term trend line remains intact, on both the weekly (shown below) and daily charts. Price action has stayed resiliently above the 260 day EMA since September 2010.

For a sustained, medium term trend, I look for the following:
- a confirmed break out above the historical resistance level - in this case 4800 points.
- all price action above the 260 and 63 day EMA's, with a rising 63 day EMA
- quarterly momentum rising above 5% signal line (and preferably own EMA)
- quarterly Positive DMI, after a recent crossover, rises above its higher signal line


- XJO short term trade: Feb 4700/4650 Bull Put Spread, looking to scale into additional contracts and/or new Feb 4750/4700 as XJO improves.
- XJO medium term trade: Mar 4600/4500 Bull Put Spread and April (when released)
 |
| WBC falling volume.... |

- CBA short term trade: Feb $49.50/49 Bull Put Spread
Westpac has finished its small correction and may be in a small upward move according to short term price action (2 strong closes above short term moving average and 15 EMA, with long tail/Doji cross candle finding support at $22), but all 3 secondary indicators do not confirm an uptrend (see chart below)
Watch for confirmation of short term uptrend in the coming week, with short term bull put spreads ($21.50 or $22 upper strike prices).
- WBC medium term trade: Mar $21/20 Bull Put Spread
Macquarie has a different structural stance to the "Four Pillar" banks.
 |
| from Chartpattern.com |

- MQG short term trade: possible Feb $39 or $39.50 long call, Feb $37.50/$37 Bull Put Spread
MQG medium term trade: Mar or Apr $35/$34 Bull Put Spread
Miners (BHP, RIO)

- BHP short term trade: take profits on any long trades if price fails to close above $46.50 target next week
- BHP medium term trade: March or April $42/41 Bull Put Spread
RIO has effectively been a sideways bullish stance since early November 2010, although the pattern does resemble a strong bull flat base (see MQG above).
 |
| Momentum (top) not confirmed |
- RIO short term trade: Feb $84/83 Bull Put Spread on confirmation (short term momentum)
- RIO medium term trade: possible long ATM call for short/medium term breakout from flat base

As mentioned in my post on WOW, watch for a sustained move on the PDI on the DMS above 30, support on the quarterly momentum and directional indicators to confirm that medium trend, and then hold on!!
Subscribe to:
Posts (Atom)


