
Tuesday, February 15, 2011
3
Tuesday, February 15, 2011
Chris Becker
 Move once, shame on me, move a second time....Well after a relatively easy trip across this great land, it seems I'm moving once again.
This time, it's the blog - we are moving across to the SuperBlog, MacroBusiness, joining a diverse group of bloggers, to talk about trading, as well as market and company analysis.
In collaboration with my business partner at Empire Investing, we will also be posting on value investing through Australian equities, including individual company analysis, valuations and other topics, all with a macro/skeptical/risk is not volatility bent.
I'll be posting exclusively there, so this short-lived blog is going to sleep.
It was fun - but the fun is just beginning at MacroBusiness!
Here's a little info on what to expect:
Read more...
A new change of address - again!

This time, it's the blog - we are moving across to the SuperBlog, MacroBusiness, joining a diverse group of bloggers, to talk about trading, as well as market and company analysis.
In collaboration with my business partner at Empire Investing, we will also be posting on value investing through Australian equities, including individual company analysis, valuations and other topics, all with a macro/skeptical/risk is not volatility bent.
I'll be posting exclusively there, so this short-lived blog is going to sleep.
It was fun - but the fun is just beginning at MacroBusiness!
Here's a little info on what to expect:
MacroBusiness was formed by four bloggers who reckon the gap between the Australian business media and reality has widened to a gulf.
That this is possible without the heavy-hand of a dictator is testament to the power of vested interests, monopolies, weak government, closed ideologies and a perennial culture of populism.
In effect, it means our leadership class can make unaccountable economic and business blunders, or, they are measured against entirely inappropriate yardsticks.
At MacroBusiness we use reason, history and ideas to bring you a bigger picture of the choices we face for our economy, businesses and investments.
We are the hedge fund of Australian business media.
Wednesday, February 9, 2011
0
Wednesday, February 9, 2011
Chris Becker
 Well I'm back here in Queensland after 4645km trip across the country. No problems or dramas except a few water crossings as previously mentioned.
Ready to get back to business! At this stage only 1 trade has gone awry whilst away (I had pared back most of my positions before leaving, given we had almost no internet reception for most of the trip).
I'll have end of week analysis posted by Friday night or Saturday morning and a trading update thereafter, including my first month's performance.
It's also the start of the earnings season with a few favourites (COH e.g) having already reported, as has CBA which has implications for future trades. I'll be under the hammer working in my investment company doing new valuations on approx. 80 companies (and the ASX50), so it will be a busy few weeks, amongst unpacking and getting a handle on our new environs!
Read more...
Back in Business

Ready to get back to business! At this stage only 1 trade has gone awry whilst away (I had pared back most of my positions before leaving, given we had almost no internet reception for most of the trip).
I'll have end of week analysis posted by Friday night or Saturday morning and a trading update thereafter, including my first month's performance.
It's also the start of the earnings season with a few favourites (COH e.g) having already reported, as has CBA which has implications for future trades. I'll be under the hammer working in my investment company doing new valuations on approx. 80 companies (and the ASX50), so it will be a busy few weeks, amongst unpacking and getting a handle on our new environs!
Sunday, February 6, 2011
0
Sunday, February 6, 2011
Chris Becker
 Our trek across this huge country of ours (you don't realise until you ceaselessly drive across it) continues - we are currently at Cobar, NSW and heading NE for our new (to be announced) home in Queensland.
Only one minor problem - a pretty badly flooded road crossing just outside Wilcannia. Fine for cars/4WD's but not this little black duck and his BMW motorcycle, so I waited for the waters to recede a bit.
Unfortunately the rest of the country's bad luck with the weather has continued, with Anthony, Yasi and now the new fires developing in the Perth suburbs. Let's hope this run of very bad luck does not continue into the rest of 2011.
Maybe the climate change guys were right after all?
Read more...
Almost there!

Only one minor problem - a pretty badly flooded road crossing just outside Wilcannia. Fine for cars/4WD's but not this little black duck and his BMW motorcycle, so I waited for the waters to recede a bit.
Unfortunately the rest of the country's bad luck with the weather has continued, with Anthony, Yasi and now the new fires developing in the Perth suburbs. Let's hope this run of very bad luck does not continue into the rest of 2011.
Maybe the climate change guys were right after all?
Saturday, January 29, 2011
2
Saturday, January 29, 2011
Chris Becker
A little introspective today from your trading blogger. I'm putting on my "philosophers" hat and taking off my trading/investors hat to talk about something that I have thought about - both publicly and privately, for many years.
My thoughts on Australia's future have evolved over time, starting from a very nationalistic bent as a youngster, to acquiring an understanding of our economic structure and place in the world and then to discover first hand via experience and travel what futures (plural) may actually lie ahead.
My progression reminds me of Francois Guizot's oft-stolen quote:
I contend that Australia has three future paths to choose from:

But all of our economic commentators, pundits and spruikers maintain that Australia's future is as bright as ever, that the sun shall never set on our wondrous economic boom - so how can we end up like some PIIG basket case, the "white trash of Asia"?
Many problems - not issues - and a drastic leadership deficit
Here are the problems I foresee:
So what have we done with this wondrous wealth? Have we saved it like Norway (approx. US$512 billion in October 2010, annual income exceeding US$70 billion as of 2008/9):

Or did we p%ss it up against a wall?


Given the brouhaha over the proposed Mineral Resources Rent Tax, any attempt at establishing a sovereign wealth fund by funneling surpluses from a mining boom, or even partial nationalisation of natural resources (e.g offshore gas fields that will produce enormous wealth in the generations ahead) will be met with indignation by both sides of politics. The "Stupid" Party will want to use the revenue to expand welfare and feel-good environmental solutions, whilst the "Evil" Parties will want to lower the tax base in a continued attempt to sustain the unsustainable debt binge imposed on Australian households.
Our tax and welfare transfer system is now beyond a joke. Its not the fact that over 42% of households receive transfer payments (i.e net pay no tax at all), a bill that makes up more than a third of the current Federal budget. Its the ridiculous nature, permutations and useless inefficiencies built into the ever-expanding tax code. Further, the tax base has shifted to the upper middle class (the upper class pay barely any tax on a relative percentage basis, due to numerous loopholes and an entrenched taxation industry), whilst the transfer base has expanded from the deserving lower class to almost all the middle class and anyone defined as a "working family".
This ties in with the ever increasing dependency ratio - more and more so-called "working Australians" now shoulder the financial burden of looking after an ageing population and a subsidised middle-class Australia. As The Unconventional Economist has pointed out, as the Baby Boomers retire and earn significantly less, the burden of high income - from which almost all taxation revenue, including property tax, spending and income taxes - falls to Gen X and Gen Y who struggle with record high mortgage repayments, whilst their Baby Boomer parents spend less (reduced GST revenue) and save more (no tax revenue, as almost all pensions and savings accounts for seniors are tax-free).

Note how the real growth in population in the coming years are the Baby Boomers - note the huge gap filled by the 35-50 year old Gen X. A quick reminder: without our extremely generous migration rate, (which fell 30% year on year recently) the natural growth rate in Australia is below replacement (currently 1.9 and falling. 2.1 births per woman is required to maintain a steady population)

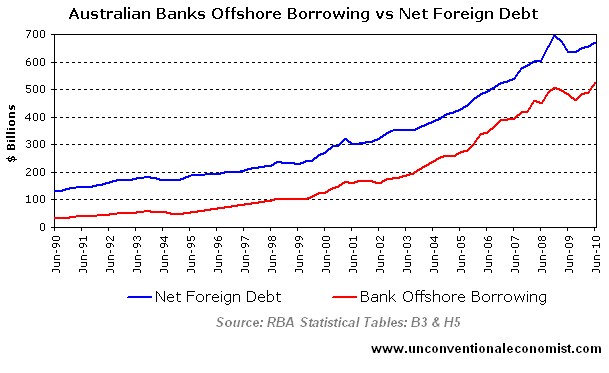
Further, contrary to popular opinion our "strong and sound economy" is based on an illusion. I've touched on this above - we have record high levels of private debt, with record low levels of government debt. All "investment" in Australia is purchasing existing houses off each other at higher and higher prices. To do so, we have borrowed over a trillion dollars, almost half of which had to come from overseas because of the lack of domestic savings (due to structurally low interest rates, which had to be lowered by the RBA because how else could First Home Buyers afford to borrow enough to buy a house of the Second Home Buyer, who then buys a house....).
Lest I remind you what a problem this has caused overseas: Australia is not different. I firmly stand in the camp that house prices are artificially high by at least 40%, and that they will not go up, in nominal terms for the next 10 or so years - either because of an outright property crash, or more likely, a generation long Japan-style deflation.
Whatever the outcome, the stark fact remains that the economy is based on exponential expansion of debt, created by banks as loans against existing dwellings, and then deposited into the economy as freshly printed money, thus creating inflation and thus the illusion of economic growth. This system has endured due to our record terms of trade via mineral exports. But it has an end point. I contend we reached it in 2010, although further artificial stimulus may prolong its drug-addicted life for another year or so at best, until it succumbs to its deserved death in 2012.
The final problem is the lack of government debt, a serious lack of investment in education, infrastructure and regional development and a widening "leadership" deficit has hampered the entire nation as we try to compete on the unlevel playing field that is unbridled Asian capitalism. Federal government debt is far, far too low - contrary to the ranting and ravings of the neoconservatives.
Our education system is broken, with a huge fiscal reliance on foreign students, and the unintended consequence of reducing our higher places of learning, research and development into "degree factories". The lack of harmonisation and any substantial investment in education - e.g there is no Federal Minister for Education - save some token gestures (free laptops. Whoop-de-frickin-do.) is holding back our children's potential, particularly in areas where we need to succeed AFTER the mining boom: science, technology and high-end manufacturing. There is no way - none at all - that Australia can compete in any low or semi-skilled arena due to our population base and distance from economic centers of activity. This country needs an education revolution - stat!
The NBN is a revelation however. A serious chance at developing some game-changing infrastructure, but I doubt the current economic managers have a clue how to roll it out effectively. Unfortunately their opponents - who are likely to be very successful at its oversight, want to scrap the whole project.
But what about high speed rail and transport infrastructure - not just for the mining sector, but for all sectors of the economy, that could provide huge returns in terms of productivity (which continues its 5 year decline). As I touched on in my "levees" post, where are the bold plans to "Flood Mitigate" (you can't flood proof anything) Queensland, or an Australian-wide water and food security system, which although economically inefficient, has future strategic implications?
For those who say we can't afford a larger national debt - say 40-60% of government debt to GDP, I say this. Would you rather we have houses that cost $600,000 and half of all mortgages owed to foreigners, and a crumbling education and infrastructure? Or a house that costs $300,000, a 21st century education and infrastructure system and a higher tax rate, the difference being your taxes go to service Federal Government bonds, most of which will be owned by Australian superannuation funds and give Baby Boomers a real income stream in retirement.
Now you see why I say we have a leadership deficit? Where are the leaders (not managers) putting forth such ideas and notions? Or are we condemned to mire in the muck of political compromise for yet another generation of spin-doctors and god-awful speeches?
Why we won't go Asian (although we might turn Japanese? I don't think so)
Culturally, we have adapted well in becoming an advanced, capitalist society. We may have "civilized capitalism" as Philip Adams says, but have we civilized our socialism?
I contend that culturally all Australians at heart are socialists - where more than anywhere in the world have you heard the phrase "the government should do something about it"?
Has anyone really celebrated the privatisation of Telstra, the Commonwealth Bank (which partly enabled a "competitive" market for unbridled credit creation) or how we are treated by private healthcare providers?
Does anyone really think that as the largest (but not greatest) generation starts their retirement they will demand less government support - particularly health care? Particularly as their own private superannuation depends almost wholesale on grossly overvalued residential property and a share market that could plunge 20% at any time? (ah, the beauty of volatility!)
We are not American, language similarities aside. Although we had a pioneering spirit like our American cousins and our colonial past was a hard, taxing life, we continue in the tradition of the fair-go and government paternalism as a given, in fact, as a demand that the State have a large say in our life, lifestyle and economy.
Both sides of politics are equally unsatisfactory in their approach to our capitalist/socialist conundrum. Partial subsidisation of education costs, but support for private schools. Increased Medicare and support services, but mandatory private health for high income workers. Tax free pensions for retirees, but higher taxes for the late Boomers and Gen X high income earners. Higher skilled migration rates, but lower investment of skilled education. It never ends, and sometimes even the "capitalist" Coalition adopts socialist measures (e.g paid parental leave) whilst "socialist" Labor adopts capitalist reforms (e.g market solution to carbon mitigation).
I don't have any solutions, just a notion: let us forget trying to forge a "middle way" (i.e stop listening to the Gordon Browns, the Kevin Rudd's et al of this world), and make a decision: are we going to be part of Asia and adopt a hard-nosed capitalist approach to social welfare, wealth distribution and growth-based prosperity, or should we just fully socialise, recognize our cultural heritage and be the Scandinavia Down Under?
With better beaches of course.
Read more...
Crossroads
 |
| Copyright Dreamworks - from "Castaway" |
My thoughts on Australia's future have evolved over time, starting from a very nationalistic bent as a youngster, to acquiring an understanding of our economic structure and place in the world and then to discover first hand via experience and travel what futures (plural) may actually lie ahead.
My progression reminds me of Francois Guizot's oft-stolen quote:
"Not to be a republican at twenty is proof of want at heart; to be one at thirty is proof of want of head."
I contend that Australia has three future paths to choose from:
- Continue with the current system, evolving into a quasi-Southern European economic model
- Adopt an Asian-based economic growth/highly capitalistic (i.e privatised) model
- Adopt a Scandinavian (i.e Norwegian) socialist style economic model
Let's get something out of the way first - I'm an idealist - intellectually and morally, I am a libertarian. I think AND believe it is the only moral system that society can adopt and sustain for freedom, prosperity and peace. For a quick primer (if you have 10 minutes to spare), please watch the "The Philosophy of Liberty".
But, I'm also a realist. In the real world, a libertarian "State" (a contradiction in terms) would not work, neither would an anarcho-capitalist variation. It either devolves into crony capitalism - i.e exactly what the USA has become, turns into a bureaucratic charade - ala the European Union, is defeated by other nations through economic or military power, or most likely - the people don't want the responsibility and would reject most of its moral notions and requirements for living in a free society.
So what does work and why?
When you examine the world and note different countries approaches, two regions stand out because of their success: Scandinavia and Asia. The former (including Denmark, Sweden, Norway and Finland) have extremely high standards of living, 100% literacy rates, very democratic government, high GDP per capita and prosperity, but low GDP growth and mild to non-existent inflation. The latter (including China, Taiwan, Hong Kong, Japan, Malaysia, Singapore, Korea etc) have rapidly growing standards of living, huge GDP growth rates, expanding populations, modest to high inflation, autocratic styles of government (which seems to work) and a vigor and vitality for hard work unmatched around the world.
The main differences are obviously cultural and, how they approach social welfare: namely, education, retirement pensions and health.
The Scandinavians adopt the maternal approach and subsidise everything - its completely "free". Services are supplied and organised by government, not the private sector, and are paid by very high taxes, both corporate and income. It is sustainable due to the tax base (with very few loopholes - IKEA aside!), the innovation of the population and in particular with Norway, the ability to save and invest the proceeds of its lucky mineral deposits in sovereign wealth funds, for future generations to enjoy.
The Asians adopt a laissez faire approach, and mainly let the private market supply (or not supply) such services, and this relatively free market has created a diverse range that cater to almost all levels of society, but of course many fall through the gaps. Some Asian nations are more proactive in this regard, some are still growing a middle class that can afford to pay for this out of their own income. The long term projection is the majority of Asians in the 21st century will pay for their own education, health and retirement. As long as disposable income growth exceeds inflation, this capitalistic model will continue to flourish.
What has this got to do with Australia, a land of fantastic mineral wealth, boundless plains, a secure and strong economy that weathered The Great Crash of 2008?
Our current Path
Our current Path
We have a hybrid version of (or bastard depending on your ideological slant) the Asian/Scandinavian model.
- High corporate and personal taxes, but high transfers of revenue for social welfare purposes, and widespread loopholes and gaming of the system (a very Asian way of approaching taxation!)
- Private superannuation (ala Singapore) but large ingrained support, including medical, dental, pharmalogical and optometric for pensioned Seniors and low-income citizens
- Capitalist economic system, with a hands-off approach to market regulation, but deep interference in politically sensitive sectors and marginal issues.
- A reliance on mineral wealth exports to increase disposable income and government revenue, but no savings or investment thereof, with extremely high levels of private debt.
Because of this hybrid: a quasi market-socialism based culture and economy, I think the future, assuming no bumps in the road, will more likely resemble Southern Europe than Asia or Scandinavia.
Not necessarily a bad thing if you've spent a summer or two in Greece, Italy or Spain, but in reality, our young nation does not have the psychological wherewithal to "endure" such economic malaise.
Not necessarily a bad thing if you've spent a summer or two in Greece, Italy or Spain, but in reality, our young nation does not have the psychological wherewithal to "endure" such economic malaise.
But all of our economic commentators, pundits and spruikers maintain that Australia's future is as bright as ever, that the sun shall never set on our wondrous economic boom - so how can we end up like some PIIG basket case, the "white trash of Asia"?
Many problems - not issues - and a drastic leadership deficit
Here are the problems I foresee:
- over reliance on mineral wealth
- hugely complicated taxation and welfare system
- structurally unsound economy, based on private debt and consumption
- ever expanding dependency ratio (i.e more retirees/welfare recipients per worker)
- lack of investment in education, infrastructure and regional development
- too many layers of government and bureaucracy
So what have we done with this wondrous wealth? Have we saved it like Norway (approx. US$512 billion in October 2010, annual income exceeding US$70 billion as of 2008/9):

Or did we p%ss it up against a wall?

Given the brouhaha over the proposed Mineral Resources Rent Tax, any attempt at establishing a sovereign wealth fund by funneling surpluses from a mining boom, or even partial nationalisation of natural resources (e.g offshore gas fields that will produce enormous wealth in the generations ahead) will be met with indignation by both sides of politics. The "Stupid" Party will want to use the revenue to expand welfare and feel-good environmental solutions, whilst the "Evil" Parties will want to lower the tax base in a continued attempt to sustain the unsustainable debt binge imposed on Australian households.
Our tax and welfare transfer system is now beyond a joke. Its not the fact that over 42% of households receive transfer payments (i.e net pay no tax at all), a bill that makes up more than a third of the current Federal budget. Its the ridiculous nature, permutations and useless inefficiencies built into the ever-expanding tax code. Further, the tax base has shifted to the upper middle class (the upper class pay barely any tax on a relative percentage basis, due to numerous loopholes and an entrenched taxation industry), whilst the transfer base has expanded from the deserving lower class to almost all the middle class and anyone defined as a "working family".
This ties in with the ever increasing dependency ratio - more and more so-called "working Australians" now shoulder the financial burden of looking after an ageing population and a subsidised middle-class Australia. As The Unconventional Economist has pointed out, as the Baby Boomers retire and earn significantly less, the burden of high income - from which almost all taxation revenue, including property tax, spending and income taxes - falls to Gen X and Gen Y who struggle with record high mortgage repayments, whilst their Baby Boomer parents spend less (reduced GST revenue) and save more (no tax revenue, as almost all pensions and savings accounts for seniors are tax-free).

Note how the real growth in population in the coming years are the Baby Boomers - note the huge gap filled by the 35-50 year old Gen X. A quick reminder: without our extremely generous migration rate, (which fell 30% year on year recently) the natural growth rate in Australia is below replacement (currently 1.9 and falling. 2.1 births per woman is required to maintain a steady population)

Who is going to continue to fund the ever expanding middle-class welfare? Given the ideological entrenchment of "no deficit spending" by both sides of politics, the fund gap will not be borrowed. That leaves taxation as the answer, which will crush any GDP growth or creation.
Lest I remind you what a problem this has caused overseas: Australia is not different. I firmly stand in the camp that house prices are artificially high by at least 40%, and that they will not go up, in nominal terms for the next 10 or so years - either because of an outright property crash, or more likely, a generation long Japan-style deflation.
Whatever the outcome, the stark fact remains that the economy is based on exponential expansion of debt, created by banks as loans against existing dwellings, and then deposited into the economy as freshly printed money, thus creating inflation and thus the illusion of economic growth. This system has endured due to our record terms of trade via mineral exports. But it has an end point. I contend we reached it in 2010, although further artificial stimulus may prolong its drug-addicted life for another year or so at best, until it succumbs to its deserved death in 2012.
The final problem is the lack of government debt, a serious lack of investment in education, infrastructure and regional development and a widening "leadership" deficit has hampered the entire nation as we try to compete on the unlevel playing field that is unbridled Asian capitalism. Federal government debt is far, far too low - contrary to the ranting and ravings of the neoconservatives.
Our education system is broken, with a huge fiscal reliance on foreign students, and the unintended consequence of reducing our higher places of learning, research and development into "degree factories". The lack of harmonisation and any substantial investment in education - e.g there is no Federal Minister for Education - save some token gestures (free laptops. Whoop-de-frickin-do.) is holding back our children's potential, particularly in areas where we need to succeed AFTER the mining boom: science, technology and high-end manufacturing. There is no way - none at all - that Australia can compete in any low or semi-skilled arena due to our population base and distance from economic centers of activity. This country needs an education revolution - stat!
The NBN is a revelation however. A serious chance at developing some game-changing infrastructure, but I doubt the current economic managers have a clue how to roll it out effectively. Unfortunately their opponents - who are likely to be very successful at its oversight, want to scrap the whole project.
But what about high speed rail and transport infrastructure - not just for the mining sector, but for all sectors of the economy, that could provide huge returns in terms of productivity (which continues its 5 year decline). As I touched on in my "levees" post, where are the bold plans to "Flood Mitigate" (you can't flood proof anything) Queensland, or an Australian-wide water and food security system, which although economically inefficient, has future strategic implications?
For those who say we can't afford a larger national debt - say 40-60% of government debt to GDP, I say this. Would you rather we have houses that cost $600,000 and half of all mortgages owed to foreigners, and a crumbling education and infrastructure? Or a house that costs $300,000, a 21st century education and infrastructure system and a higher tax rate, the difference being your taxes go to service Federal Government bonds, most of which will be owned by Australian superannuation funds and give Baby Boomers a real income stream in retirement.
Now you see why I say we have a leadership deficit? Where are the leaders (not managers) putting forth such ideas and notions? Or are we condemned to mire in the muck of political compromise for yet another generation of spin-doctors and god-awful speeches?
Why we won't go Asian (although we might turn Japanese? I don't think so)
Culturally, we have adapted well in becoming an advanced, capitalist society. We may have "civilized capitalism" as Philip Adams says, but have we civilized our socialism?
I contend that culturally all Australians at heart are socialists - where more than anywhere in the world have you heard the phrase "the government should do something about it"?
Has anyone really celebrated the privatisation of Telstra, the Commonwealth Bank (which partly enabled a "competitive" market for unbridled credit creation) or how we are treated by private healthcare providers?
Does anyone really think that as the largest (but not greatest) generation starts their retirement they will demand less government support - particularly health care? Particularly as their own private superannuation depends almost wholesale on grossly overvalued residential property and a share market that could plunge 20% at any time? (ah, the beauty of volatility!)
We are not American, language similarities aside. Although we had a pioneering spirit like our American cousins and our colonial past was a hard, taxing life, we continue in the tradition of the fair-go and government paternalism as a given, in fact, as a demand that the State have a large say in our life, lifestyle and economy.
Both sides of politics are equally unsatisfactory in their approach to our capitalist/socialist conundrum. Partial subsidisation of education costs, but support for private schools. Increased Medicare and support services, but mandatory private health for high income workers. Tax free pensions for retirees, but higher taxes for the late Boomers and Gen X high income earners. Higher skilled migration rates, but lower investment of skilled education. It never ends, and sometimes even the "capitalist" Coalition adopts socialist measures (e.g paid parental leave) whilst "socialist" Labor adopts capitalist reforms (e.g market solution to carbon mitigation).
I don't have any solutions, just a notion: let us forget trying to forge a "middle way" (i.e stop listening to the Gordon Browns, the Kevin Rudd's et al of this world), and make a decision: are we going to be part of Asia and adopt a hard-nosed capitalist approach to social welfare, wealth distribution and growth-based prosperity, or should we just fully socialise, recognize our cultural heritage and be the Scandinavia Down Under?
With better beaches of course.
Friday, January 28, 2011
0
Friday, January 28, 2011
Chris Becker
 Well this is great news: just a few days before I leave to go to Queensland, a tropical cyclone is right on track to hit our area this weekend.
For reference, I live just above Bunbury: i.e in the middle of the forecast path.
Its not as bad as the storm in a teacup re: the Gillard Flood Levy.
Given that well over 40% of the households in this country receive more money than they pay in taxes and that over $109 billion was spent on social welfare in the 2009/10 Budget, the puny amount raised by the levy (around $1.8 billion) pales into insignificance.
I wonder though what would have been more efficient:
Sure, the former would create an income liability stream that needs funding, and would raise the national debt (which would again focus the mainstream commentariats effort on bashing the government on its extremely minor total debt position, whilst ignoring the real debt problem: households and State governments).
But the latter will inevitably result in unintended consequences, particularly the more wealthier using many available loopholes to legally reduce this new tax (although negative gearing won't be one of them - as pointed out by The Unconventional Economist, most property "investors" (sic) are in lower tax brackets than those affected materially by this levy), and the inevitable wastage and inefficiencies that go with collecting a new, temporary tax.
Had the Gillard Government been bold and gone for Option 1, and extended this to say, $20 or $30 billion and planned a major infrastructure initiative, including a widespread flood mitigation system for the entire state of Queensland, in the long run, would that have been a bad thing?
As I've stated before, this country suffers from four deficits, one is minor but could blow out of control due to the structurally unsound property market ala Spain - the Federal budget; two will eventually come back to haunt us as we squandered a whole generation's wealth and purposely destroyed our manufacturing industry and high skill base (the trade deficit and the savings deficit - i.e record household debt), but the one most in deficit in this country is leadership.
Read more...
Cyclones, Floods and Levies (Levees?)
 Well this is great news: just a few days before I leave to go to Queensland, a tropical cyclone is right on track to hit our area this weekend.
For reference, I live just above Bunbury: i.e in the middle of the forecast path.
Its not as bad as the storm in a teacup re: the Gillard Flood Levy.
Given that well over 40% of the households in this country receive more money than they pay in taxes and that over $109 billion was spent on social welfare in the 2009/10 Budget, the puny amount raised by the levy (around $1.8 billion) pales into insignificance.
I wonder though what would have been more efficient:
- Borrow the money by selling Australian government bonds (a market that desperately needs more liquidity so our myopic fund managers can stop buying BHP and the banks, inflating their share prices, and actually allocate capital properly), providing a welcome home for genuine savers, OR
- Take the money off the wealthy, and waste about 20-30% of it on collection and accounting/bureaucratic malaise at the ATO (and countless HR departments around the country)
Sure, the former would create an income liability stream that needs funding, and would raise the national debt (which would again focus the mainstream commentariats effort on bashing the government on its extremely minor total debt position, whilst ignoring the real debt problem: households and State governments).
But the latter will inevitably result in unintended consequences, particularly the more wealthier using many available loopholes to legally reduce this new tax (although negative gearing won't be one of them - as pointed out by The Unconventional Economist, most property "investors" (sic) are in lower tax brackets than those affected materially by this levy), and the inevitable wastage and inefficiencies that go with collecting a new, temporary tax.
Had the Gillard Government been bold and gone for Option 1, and extended this to say, $20 or $30 billion and planned a major infrastructure initiative, including a widespread flood mitigation system for the entire state of Queensland, in the long run, would that have been a bad thing?
As I've stated before, this country suffers from four deficits, one is minor but could blow out of control due to the structurally unsound property market ala Spain - the Federal budget; two will eventually come back to haunt us as we squandered a whole generation's wealth and purposely destroyed our manufacturing industry and high skill base (the trade deficit and the savings deficit - i.e record household debt), but the one most in deficit in this country is leadership.
Monday, January 24, 2011
0
Monday, January 24, 2011
Chris Becker
 The table below summarises all suggested trades on this blog, mentioned in End of Week Market Analysis and any individual security summaries.
Read more...
My Trades - as of 24th January, 2011

Accumulative Profit as of 24th January is $2474.
What does that mean? It assumes I have opened 1 option contract, 500 warrants or a 1000 share parcel in each suggested trade.
In reality, I would have different capital allocation decisions depending on the trade risk profile/equity at risk and other factors.
In my monthly performance updates, I will disclose my actual equity results on a percentage basis, which includes brokerage, slippage and other costs.
Defensive Actions (DA column) since last update:What does that mean? It assumes I have opened 1 option contract, 500 warrants or a 1000 share parcel in each suggested trade.
In reality, I would have different capital allocation decisions depending on the trade risk profile/equity at risk and other factors.
In my monthly performance updates, I will disclose my actual equity results on a percentage basis, which includes brokerage, slippage and other costs.
Post Date | Suggested Trade | Confirm Date | Codes | DA | Exit Date | Profit/Loss | Accumulative |
10-Jan-11 | XJO Feb 4700/4650 BPS | 10-Jan-11 | TN7/TM7 | $180 | $180 | ||
XJO Mar 4900/4500 Strangle | 10-Jan-11 | UB8/U28 | $1,000 | $1,180 | |||
BHP Feb $44/43 BPS | 12-Jan-11 | EZ7/K27 | YES | 21-Jan-11 | -$50 | $1,130 | |
RIO Feb $84/83 BPS | 13-Jan-11 | TK9/CF7 | YES | 20-Jan-11 | -$140 | $990 | |
WOW Feb $26/25 BPS | 11-Jan-11 | V58/V18 | YES | 20-Jan-11 | $90 | $1,080 | |
15-Jan-11 | XJO Feb 4700/4650 BPS | 14-Jan-11 | TN7/TM7 | $100 | $1,180 | ||
XJO Mar 4600/4500 BPS | 14-Jan-11 | U58/U28 | $174 | $1,354 | |||
CBA Feb $49.50/49 BPS | 14-Jan-11 | FK8/UF7 | $170 | $1,524 | |||
WBC Feb $22/21.50 BPS | NYC | LT9/LP9 | $1,524 | ||||
WBC Mar $21/20 BPS | 14-Jan-11 | FI8/FH8 | $130 | $1,654 | |||
MQG Feb $39 long call | 17-Jan-11 | SQ7 | YES | 24-Jan-11 | $80 | $1,734 | |
MQG Feb $37.50/37 BPS | 14-Jan-11 | NU7/NY7 | $80 | $1,814 | |||
MQG Mar $35/34 BPS | 14-Jan-11 | Z29/Z19 | $75 | $1,889 | |||
BHP Mar $42/41 BPS | 14-Jan-11 | Z28/YX8 | $120 | $2,009 | |||
RIO Feb $84/83 BPS | 14-Jan-11 | TK9/CF7 | YES | 20-Jan-11 | -$60 | $1,949 | |
WOW Feb $27.50 long call | 17-Jan-11 | R58 | YES | 20-Jan-11 | $45 | $1,994 | |
WOW Feb $26.50/26 BPS | 14-Jan-11 | QX8/V58 | YES | 20-Jan-11 | $15 | $2,009 | |
WOW Mar $26/25 BPS | 14-Jan-11 | FQ8/FP8 | YES | 20-Jan-11 | $15 | $2,024 | |
22-Jan-01 | XJO Mar 4600/4500 BPS | 24-Jan-11 | U58/U28 | $200 | $2,224 | ||
CBA Feb $49.50/49 BPS | 21-Jan-11 | FK8/UF7 | $130 | $2,354 | |||
WOW Mar $29/29.50 BCS | 20-Jan-11 | FY8/G58 | $120 | $2,474 |
- MQG long option trade closed on the open 20th January due to KC Signal confirmation
- All bullish WOW, RIO and BHP trades were stopped out on the 20th of January due to "End of Uptrend" price action analysis.
Legend:
- BPS - Bull Put Spread
- BCS - Bear Call Spread
- Blog Entry Date - date suggested trade was mentioned
- Confirmation Date - date when trade was opened, on confirmation of entry signal.
Notes to Table:
- Currently open trades obviously have no "Exit Date" entry, but initial profit (premium on entry) or loss (capital allocated, e.g shares bought) is calculated
- Entry and exit price are calculated from closing price on Confirmation Date
- Profit/loss is calculated per option contract (1 XJO point is $10, 1 equity option cent per contract is also $10 - 1000 shares per contract) or per 1000 shares or 500 warrants (assumed leverage of 50%).
- A long call or put or purchased share or warrant has an immediate "loss" as a debit is made, whilst a sold call or put or credit spread has an immediate "profit". Final profit/loss is calculated on exit.
- No brokerage, ACH fees, slippage (buy/sell spread) or liquidity/fill problems are assumed or calculated.
Important Information:
The content, information and any advertisements of this blog should not be taken as investment advice nor a recommendation to buy or sell, or utilise any strategy mentioned. The author may or may not have a underlying position or is considering a position in any or all of the securities or strategies mentioned. You are responsible for the outcome of your own actions, seek advice before investing or trading your own capital.
0
Chris Becker
Is there any better description of the so-called "free market"?
I know of a few economists and spruikers who could match Calvin's attitude here, but that would be insulting to Calvin....
Read more...
Classic Calvin and Hobbes....replace "lemonade" with "property"
 |
| subsidized = FHBG, RBA low interest rates, demand equals "underlying demand" and so on... |
I know of a few economists and spruikers who could match Calvin's attitude here, but that would be insulting to Calvin....
0
Chris Becker
 The S&P/ASX200 Index (XJO) closed the week at 4755 points, below long term resistance at 4800 points. The jostle between the bulls and bears continue, with BHP and RIO (discussed in detail below) dragging the market back after a one-day leap across the pivotal 4800 barrier.
 Conclusion
XJO remains a frustrating market, best served at the moment by either standing aside or non-directional trades, with a bullish bias - although the brave few could utilise a long term bear trade at 5000 or more points (I'd book up on macro factors there though! Although I personally believe the current market is overvalued and Australia is heading into a long recession, I can't say the same for those who actually move markets. I find "Jesus" whenever I'm wrong!)
XJO medium term trade: March or April 4600/4500 Bull Put Spread
The Banks (CBA, WBC, MQG)
Commonwealth Bank (CBA), as expected last week, is in a small uptrend which is gathering momentum.

Conclusion
CBA is in a short term trend that wants to manifest itself as a new medium term trend, with a possible target of $60 (by around the end of April?) These are VERY early days yet, and I would caution any medium term trades or capital allocation until CBA earning's announcements on the 9th of February, with ex-dividend on the 14th (possible dividend yield play here...)
CBA short term trade: Feb $49.50/$49 Bull Put Spread
Westpac is again trying to break out of its medium term sideways bearish funk. As mentioned in last week's analysis, a short term uptrend was trying to form, but entry was denied by lack of confirmation by secondary indicators. Permission has since been granted.

Conclusion
WBC is in a weak short term uptrend, yet to be fully confirmed. Structurally it remains in a sideways bearish stance. I remain cautious about putting on any bullish trades (of any substance) at this time.
Macquarie Group (MQG) has finished the week flat after a great breakout. As mentioned in last week's analysis, a KC Signal was forming - and then confirmed with a bearish engulfing candle on the 20th. Good entry point for long share/warrant traders, bad exit for long option (volatility) traders.

Conclusion
MQG has had a great run in the last couple of weeks and is now consolidating before its next move, as it appears overbought. Most secondary indicators suggest a new medium term trend, but the key signal is a crossing of the upper line on medium term momentum, reinforced by a new support area of $40. Be quick on MQG, as always.
MQG possible medium term trade: long warrant/share, on confirmation

Conclusion
Conclusion
Read more...
End of Week Market Analysis - 22nd January, 2011

- Trend - the short term trend is flat, with 15 day EMA going nowhere, but the medium term trend is still intact, with price above the trendline and 13 week EMA.
- Momentum - crucially, medium term momentum will not penetrate the upper signal line. This is no new bull market. In the short term, momentum is positive, but sideways.
- Direction - in the short term, directional strength confirms price action analysis: a positive bias, but no strength. Medium term directional strength is waning, but remains positive.
- Cycle - the medium term cycle remains bullish, although intra-week did fall below a "bull" signal. This weakness extends into the short term cycle, although a break below the 0 line did not eventuate (which would indicate a short term correction)
- Support - support remains at 4700 in the short term and 4200 in the medium/long term.
- Volume - medium term volume is flat, but positive, whilst in the short term, has dipped below zero for the first time since the new year week-long correction.

XJO remains a frustrating market, best served at the moment by either standing aside or non-directional trades, with a bullish bias - although the brave few could utilise a long term bear trade at 5000 or more points (I'd book up on macro factors there though! Although I personally believe the current market is overvalued and Australia is heading into a long recession, I can't say the same for those who actually move markets. I find "Jesus" whenever I'm wrong!)
XJO medium term trade: March or April 4600/4500 Bull Put Spread
The Banks (CBA, WBC, MQG)
Commonwealth Bank (CBA), as expected last week, is in a small uptrend which is gathering momentum.

- Trend - the short term trend is up, with price action all above the 15 day EMA and no closes below the 7 day HI EMA. A medium term trend from the low's of November 2010 may be developing, with current activity in the upper area of a trend channel. Recent price action is above the long term 260 day EMA, which is bullish.
- Momentum - In the short term, momentum confirms a continued short term uptrend, but medium term momentum indicates a bear market rally only at this stage.
- Direction - short term positive strength is dropping slightly, but still confirms above signal line. The medium term PDI has just crossed over the NDI above the signal line, but NDI has not crossed below 20 - trade management rules deny any medium term or large capital allocation until this level drops.
- Cycle - the medium term cycle is now bullish, supporting local/short term cycle.
- Support - there is localised support at $49.50-$50 in the short term and $47.50 in the medium term. CBA reached a high of almost $60 in April 2010, which could be this moves target?
- Volume - volume is positive on both scales, although I'd like to see a higher number of the short-term Force Index.
Conclusion
CBA is in a short term trend that wants to manifest itself as a new medium term trend, with a possible target of $60 (by around the end of April?) These are VERY early days yet, and I would caution any medium term trades or capital allocation until CBA earning's announcements on the 9th of February, with ex-dividend on the 14th (possible dividend yield play here...)
CBA short term trade: Feb $49.50/$49 Bull Put Spread
Westpac is again trying to break out of its medium term sideways bearish funk. As mentioned in last week's analysis, a short term uptrend was trying to form, but entry was denied by lack of confirmation by secondary indicators. Permission has since been granted.

- Trend - the short term trend is up, with classic price action gravitating around the 7 day HI EMA, with no intra-day action touching the 7 day LO EMA. The weekly trend is weak to non-existent.
- Momentum - Like CBA, WBC is technically in a bear market, so any momentum that reverses but is yet to break into positive territory, or cross the upper signal line suggests a very short term rally. Medium term momentum indicates a reversion to the mean and does not yet suggest any sustained price action.
- Direction - The medium term NDI continues to drop, but has not crossed below the lower signal line, whilst PDI floats below. This is reflected in the short term DMI readings, although NDI is obviously dropping, but not yet below the lower signal line.
- Cycle - the short term cycle is bullish, with a great indicator confiriming the end of the previous correction and the start of a new short term trend. The medium term cycle is now sideways bullish.
- Support - there is localised support at $22 in the short term and $21 in the medium term. WBC reached a high of $28 in April 2010, a long way off its current price. There is a sloping resistance line at $23 - a weekly close above this level (this or next week) would strongly suggest a new trend.
- Volume - volume is positive on both scales, rising in the short term, but flat medium-term.
Conclusion
WBC is in a weak short term uptrend, yet to be fully confirmed. Structurally it remains in a sideways bearish stance. I remain cautious about putting on any bullish trades (of any substance) at this time.
Macquarie Group (MQG) has finished the week flat after a great breakout. As mentioned in last week's analysis, a KC Signal was forming - and then confirmed with a bearish engulfing candle on the 20th. Good entry point for long share/warrant traders, bad exit for long option (volatility) traders.

- Trend - the short term trend has finished, but it is likely to move sideways. The weekly trend is a flat base pattern which suggests continued bullishness. Although the close on the 20th was very bearish, it did not break the trailing stop nor close below the 7 day LO EMA.
- Momentum - Medium term momentum is now positive and moving towards the upper signal line to confirm a new medium term trend. Short term momentum, after a classic KC Signal, has retraced but still positive, above upper signal line and own EMA. This signals continued strength.
- Direction - The medium term PDI has crossed the upper signal line, which confirms a new medium term trend. This is reflected in the short term DMI readings, with a very strong ADX signal line (which I use rarely) suggesting overbought conditions.
- Cycle - the short term cycle remains bullish, although it has dipped below the 100 line. The medium term cycle suggests overbought, but is reverting to more sedate conditions.
- Support - there is localised support at $39.50 in the short term and $37 in the medium term. Historical resistance at $40 remains a barrier to a continued move, but will become support if it gets underway.
- Volume - strong volume signals on both scales (positive since October 2010) but flat in the short term.
Conclusion
MQG has had a great run in the last couple of weeks and is now consolidating before its next move, as it appears overbought. Most secondary indicators suggest a new medium term trend, but the key signal is a crossing of the upper line on medium term momentum, reinforced by a new support area of $40. Be quick on MQG, as always.
MQG possible medium term trade: long warrant/share, on confirmation
The Miners (BHP, RIO)
BHP Billiton (BHP), ended the week poorly, although it found some support, on nervousness about China and its runaway economy.
 |
| note close below the trendline but not the 63 EMA (green line) |
- Trend - the short term trend is sideways at best, down at worst, with choppy price action, although supported by the 63 day EMA/13 week EMA. Weekly price has closed below the medium term trendline and all moving averages have 'stacked'. This is bearish for the short- and medium-term.
- Momentum - Medium term momentum has failed to make a new high 3 weeks in a row, but it is still above its own EMA and upper signal line. a bear market rally only at this stage. Short term is below 0 and own EMA, suggesting continued weakness.
- Direction - The medium term PDI has dropped significantly, but is still above its lower signal line. NDI is also very weak. No directional confirmation here at all. Conversely, short term NDI has crossed over its upper signal line due to Friday's poor close. But, PDI is still above its upper signal line. Again, no confirmation here either.
- Cycle - the short term cycle is now bearish, having dropped below -100. The medium term cycle however, has moved from bullish to sideways bullish. This is the clearest signal that a correction is not underway. Yet.
- Resistance - there is signficiant resistance at $46 for BHP, near a 3-year high. i.e BHP is approx. where it was at the height of The GFC Episode One - "The Credit Menace". There is localised support at $44.50 and $43.
- Volume - volume is slipping on both scales, although in the short term it is now negative, in the medium term it has crossed its own EMA - a clear sign of lack of buying support at these high prices.
Conclusion
BHP is at a cross-roads. Will it continue its truly awesome strength and reach new 3 and 4 year highs on the back of increased commodity prices (due to the profilgateness of the US Federal Reserve)- or is it too geared to the miracle China story? Again, I'm looking at a combination of price action (a continued fail below the medium term trendline) and momentum before acting.
BHP: cover all bull trades, stand aside.
Rio Tinto (RIO), like BHP, ended the week poorly, and continued its sideways action. Are we still witnessing a bullish flat base pattern?

- Trend - the short term trend is down, with lower highs in the past few weeks, although price remains supported by the 63 day EMA/13 week EMA. Weekly close is barely above the 13 week EMA. This suggest continued sideways action for the short- and medium-term.
- Momentum - Medium term momentum has now fully slipped below the upper signal line (signifying a sustained medium term trend) but still remains above the lower signal line, indicating continued bullish support. Friday's close took short term momentum to below zero, but EMA is still neutral sideways.
- Direction - Short term NDI has crossed over its upper signal line due to Friday's poor close and PDI is now below its upper signal line. This would normally confirm a new correction is underway.
- Cycle - similarly, the short term cycle is confirmed as bearish, having dropped below -100. The medium term cycle however, has moved to sideways bearish only, but it is closely reverting to a bearish position.
- Resistance - there is signficiant resistance at $88 for RIO, or back to where it was in September, 2008 - similarly to the where commodity prices were then and now... There is localised support at $84 and medium term support at $81.50/82 area.
- Volume - the short term Force Index has been broadly negative for RIO since November 2010, slipping past a support level, whilst it finished the week in the negative on the medium term scale. Like BHP , this indicates a lack of buying support at these high prices.
Conclusion
Is RIO stabilising after a great run up from September to December ($72 to $86) reflecting the Fed's QE2 program - OR - is it getting ready for a large pullback as signs abound that not all is well? Just like BHP, I'm looking at a combination of price action (a breakout above resistance at $88 or a failure at $82) and momentum to confirm before acting.
RIO: cover all bull trades, stand aside.
Woolworths (WOW) Last but not least, let's look at WOW. After a very quick uptrend, WOW has finished the week bearish, with a large sell-off before announcing profit guidance on Monday. Given that JPMorgan recently upgraded WOW to a buy - a great contrarian signal - does this bode well for next week's action?

surfing W O W.... - Trend - the short term trend was sideways bullish and then quickly reversed, although price did not close below the 7 LO EMA, it broke the current trendline. Weekly close is still above the 13 week EMA, but all moving averages are clustering (and frustratingly, the 260 day EMA remains flat).
- Momentum - Medium term momentum remains below zero and its own EMA and is slipping. Short term momentum has closed below the upper signal line and its own EMA which is very bearish.
- Direction - Short term NDI has crossed over its upper signal line due to Friday's poor close, with PDI now below its upper signal line. A crossover is not yet in place. This would normally confirm a new correction is underway. On the medium term scale, NDI is still above the lower signal line, which confirms that the short term trend has no hold, even though PDI is rising.
- Cycle - The medium term cycle attempted a change to a bullish sideways stance but is now neutral. A KC Signal in the short term cycle was confirmed with a move back to sideways bullish. For WOW - which has constant short-term cyclical moves, this signal is very bearish.
- Resistance - WOW has a very long term resistance at $30 and support at $25.50. Localised support at just over $26 is a probable price target in any continued downtrend. A break below that area is unlikely, but makes for great investing opportunities.
- Volume - the short term Force Index spiked before ending the week below its own EMA, another bearish sign. On the medium term scale, it still remains positive.

Conclusion
WOW remains one of my favourite stocks to trade (and company to invest in - sly and demoralising sales tactics it uses with farmers aside) and continues to show that favouritism! I closed a number of trades intra-week due to the volatility and remained concerned at Monday's earnings announcement. Given WOW's previous behaviour, the only trades to consider at the moment is a long dated Bear Call Spread near historic resistance (very low payoff, high probability of success) or a cash secured put for investment purposes (say at $26 or $25.50 level)
WOW short term trade: cover all bull trades, March $29/$29.50 Bear Call Spread
Note: one of my readers recently timed a covered call trade on WOW to perfection - with Friday's fall he made a 14% annualised return, but he is keeping his WOW shares for the long term (doing the trade in Self Manager Super Fund (SMSF). A great strategy combined with cash secured put buying for those with the time, capital and nous to add a few more percentage points of performance to your biggest investment (no your house doesn't count!). I intend to post on this "Super" trading system in the near future. Watch this space.
Subscribe to:
Posts (Atom)


